


BRICS
March 23, 2026
BRICS, G7 & NATO Split on Iran, Energy Crisis Equal to 70s Oil Shocks
Global GDP growth in 2026 has a new center of gravity, and it is not Washington or Berlin. The IMF economic forecast confirms what has been building for years: the Global South is now the world’s primary economic engine, with BRICS nations and ASEAN economies together generating roughly 56% of all global real GDP growth this year. China leads at 26.6%, India at 17.0%, and the two alone account for 43.6% of world expansion. The United States contributes 9.9%, and Germany sits at just 0.9%. This is not a blip.
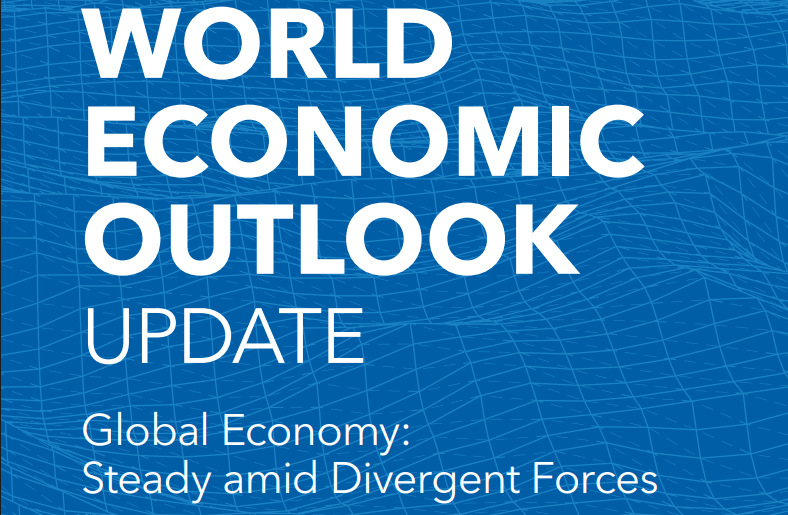
The IMF stated:
“Global growth is projected to remain resilient at 3.3 percent in 2026… headwinds from shifting trade policies are offset by tailwinds from surging investment related to technology, more so in North America and Asia than in other regions.”
Also Read: JPMorgan Raises Gold Forecast to $6,300 and Makes Case for $8,000
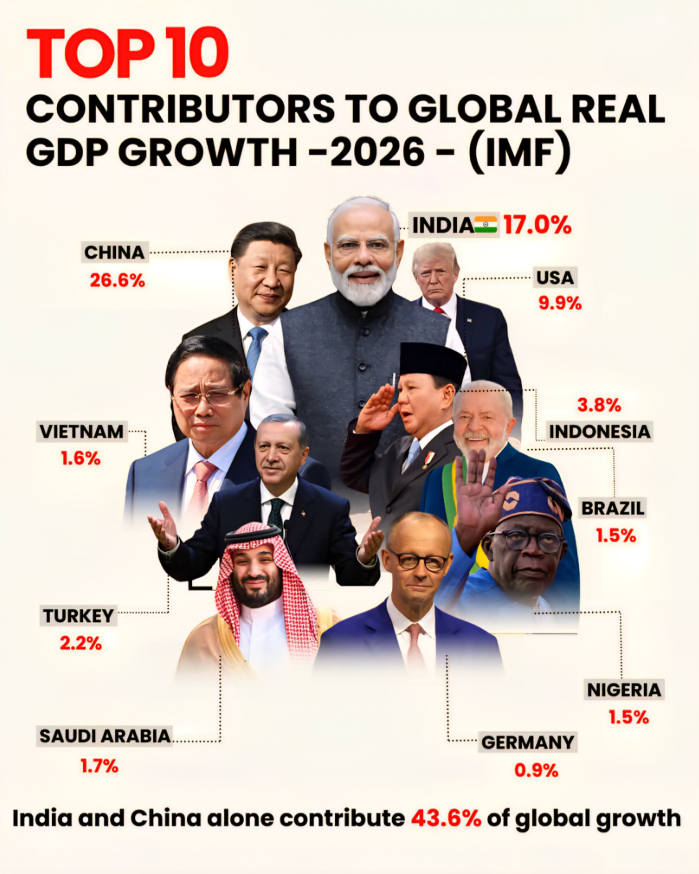
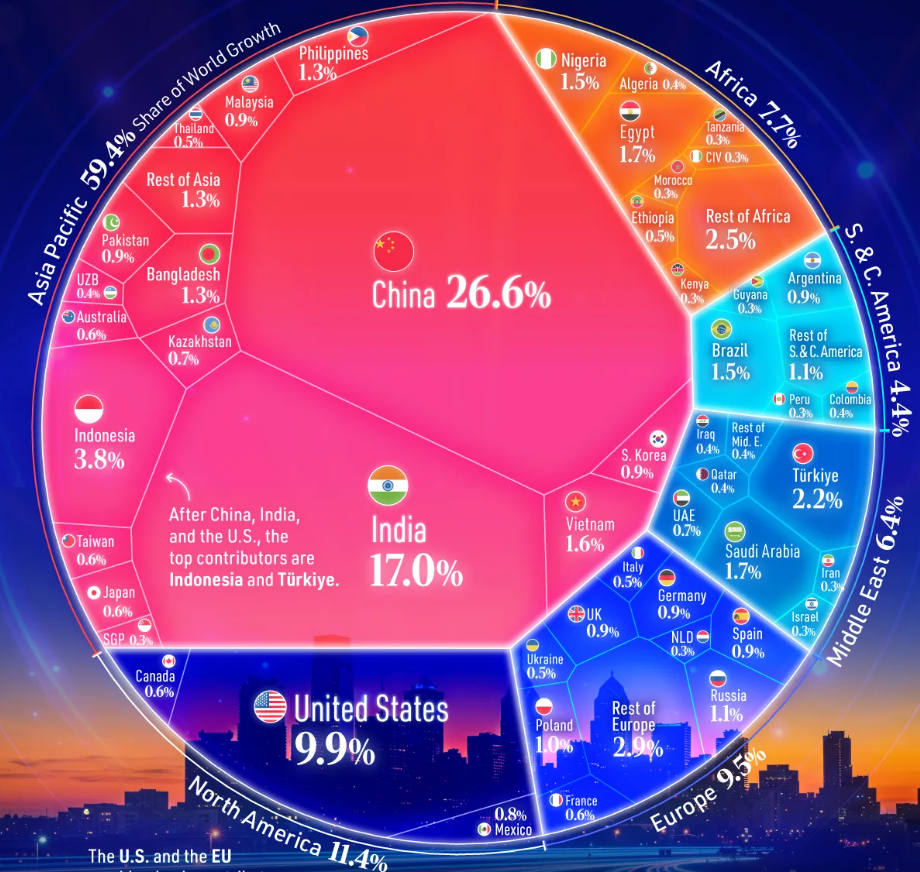
The IMF economic forecast’s top ten contributors to global GDP growth make the picture impossible to ignore. After China, India, and the U.S., every country on the list is part of the emerging markets growth bloc. Indonesia at 3.8%, Turkey at 2.2%, Saudi Arabia at 1.7%, Vietnam at 1.6%, Brazil at 1.5%, Nigeria at 1.5%. BRICS growth and ASEAN economic output now far outpace the combined Western contribution, with Europe sitting at just 9.5% of world growth and North America at 11.4%.
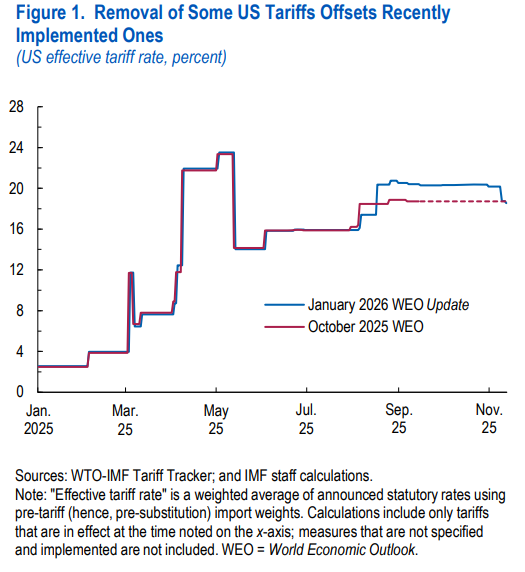
The US effective tariff rate has also been climbing sharply since early 2025, adding uncertainty to trade flows that has, in many cases, redirected manufacturing activity toward ASEAN economies.
Also Read: Central Bank Gold Buying Is Driving a Global Price Spike

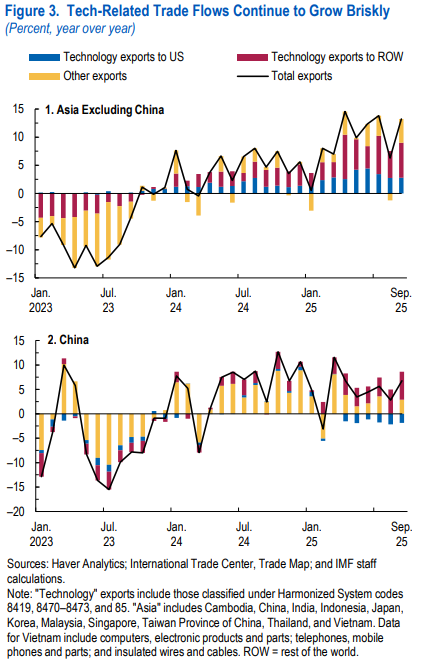
Vietnam and Indonesia are central to the ASEAN economic outlook, and both have been benefiting directly from supply chain restructuring away from China. Technology-related exports from Asia excluding China have been growing briskly year over year, and the IMF noted:
“Global trade has remained relatively robust, with brisk expansion in technology-related exports offsetting slowing momentum in exports in other product categories.”
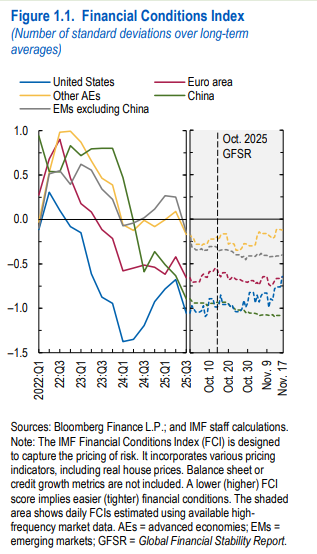
Financial conditions across emerging markets have also been accommodative, supporting BRICS growth and broader emerging markets growth.

The IMF economic forecast does not frame this as a temporary surge. Demographics, manufacturing capacity, and rising domestic consumption are sustaining emerging markets growth in ways that are not easily reversed. Risks remain, and the IMF flagged that:
“Trade tensions could flare up, prolonging uncertainty and weighing more heavily on activity. Domestic political tensions or geopolitical tensions could erupt, introducing new layers of uncertainty and disrupting the global economy through their impact on financial markets, supply chains, and commodity prices.”
Asia Pacific as a whole accounts for 59.4% of world growth. Africa contributes 7.7%, and South and Central America add 4.4%. Global GDP growth is being redistributed, and the direction is not changing anytime soon.
Also Read: De‑Dollarization: Trump’s Tariffs Aid China and Brazil as the EU Stands Ground