


Bitcoin
April 5, 2026
Charles Schwab to Enter the Crypto Trading Space By June 2026
Dan Zanger chart patterns sit behind one of the most extraordinary trading runs ever recorded. Starting with $10,775, Zanger reached $42 million in roughly 18 months by systematically trading a handful of repeatable breakout setups, each built around the same core idea: tight price action, drying volume, and stocks showing exceptional relative strength before a big move. His breakout trading strategy was not about prediction. It was about reading supply and demand on a chart and waiting for the moment sellers disappeared.
Also Read: DSRV and SBI Ripple Asia Launch Korea–Japan Remittance Pilot on XRPL

The high-tight flag was the most explosive setup in Dan Zanger chart patterns. A stock first had to advance more than 100% in under two months, then consolidate three to five weeks, correcting no more than 20 to 25%.
Volume drying up inside the base and a tight trigger bar on the 10- or 21-day EMA signaled that sellers were gone and the next leg up was loading.
Flags and pennants were the most frequently recurring setups in Zanger’s momentum stock trading, appearing across charts from 1926 to 2023. Flags form with lower highs and lower lows, pennants with lower highs and higher lows.
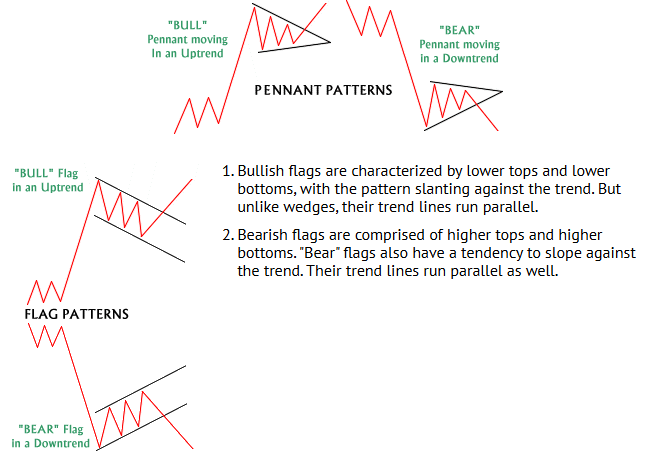
Both follow a fast strong move, and both require volume to dry up inside the base, with gap-down reversal bars snapping back strongly as confirmation that demand was still firmly in control.
The cup and handle ran seven to twelve weeks in Dan Zanger chart patterns, with the cup declining 20 to 35% and the handle correcting no more than 10 to 15%.
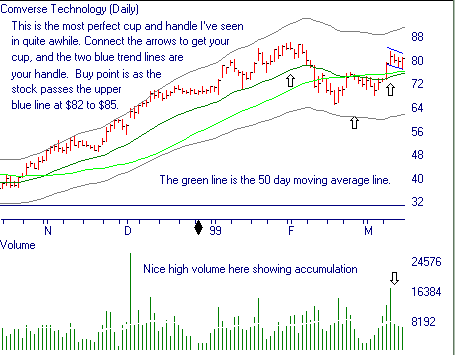
The single strongest signal was the relative strength line hitting 52-week highs while the stock was still building the base, which Zanger treated as proof that institutions were accumulating shares before the breakout even happened.
Also Read: Meta to Launch Stablecoin Payments Across Facebook, Instagram, and WhatsApp
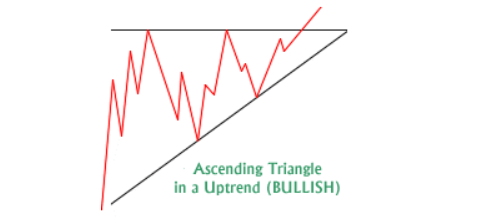
The ascending triangle showed up in Dan Zanger’s technical analysis patterns as a flat top with rising lows, reflecting buyers stepping in at higher prices each time the stock pulled back. Volume contracted toward the apex, and a breakout through flat resistance on expanding volume confirmed the high-growth trading setup was ready.
The flat base or Darvas box was a horizontal consolidation of at least three to four weeks, with the 10-day EMA respected throughout. A tight inside bar with very low volume in the week before the breakout was treated as the clearest absorption signal in Zanger’s breakout trading strategy, often preceding some of the cleanest moves in his entire run.
Also Read: Stripe’s $159B Valuation Sets the Stage for Potential PayPal Takeover
Wedge formations produced similar tight trigger bars before breakouts, while parabolic curves after multiple base breakouts were read as distribution signals in his technical analysis patterns, a sign to sell rather than buy as institutions offloaded shares to late retail buyers.