


Markets
April 1, 2026
Markets Rally After Trump Says US Could Exit Iran War in 2–3 Weeks
S&P 500 crash hedging has hit record levels, with put options demand now exceeding anything seen during the 2020 crash, the 2022 bear market, and the 2008 financial crisis. Estimated S&P 500 put delta positioning has dropped to -$70 billion, the most negative reading since at least the financial crisis, according to JPMorgan data. That means investors are currently holding the largest dollar amount of S&P 500 put options in history, driven by rising S&P 500 volatility fears and a broader investor fear index hitting historic extremes.
Also Read: XRP Price Prediction: Analysts Say 2017 Pattern Could Trigger 1500% Breakout
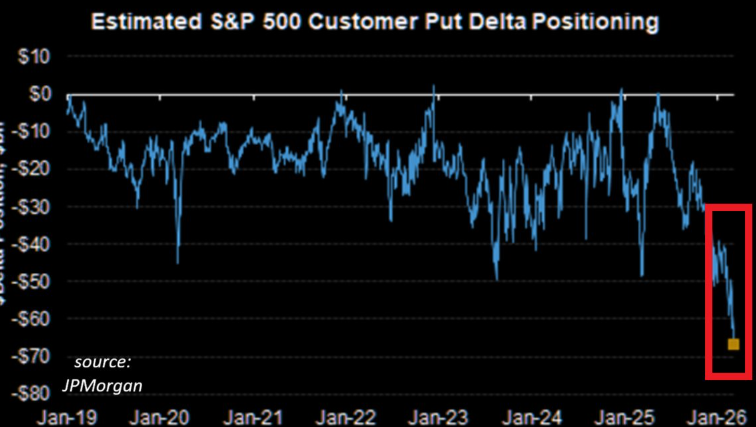
The JPMorgan chart above shows put delta positioning collapsing to around -$70 billion in early 2026, a level that has never been recorded before. Market crash hedging at this scale reflects a level of fear that goes beyond typical corrections.
Global Markets Investor stated:
“Investors are hedging against an S&P 500 crash at a record rate. Estimated S&P 500 put delta positioning is down to -$70 billion, the most negative since at least the financial crisis. This even exceeds the 2020 crash, the 2022 bear market, and the April 2025 selloff. Wall Street has rarely been this fearful of a market drop.”
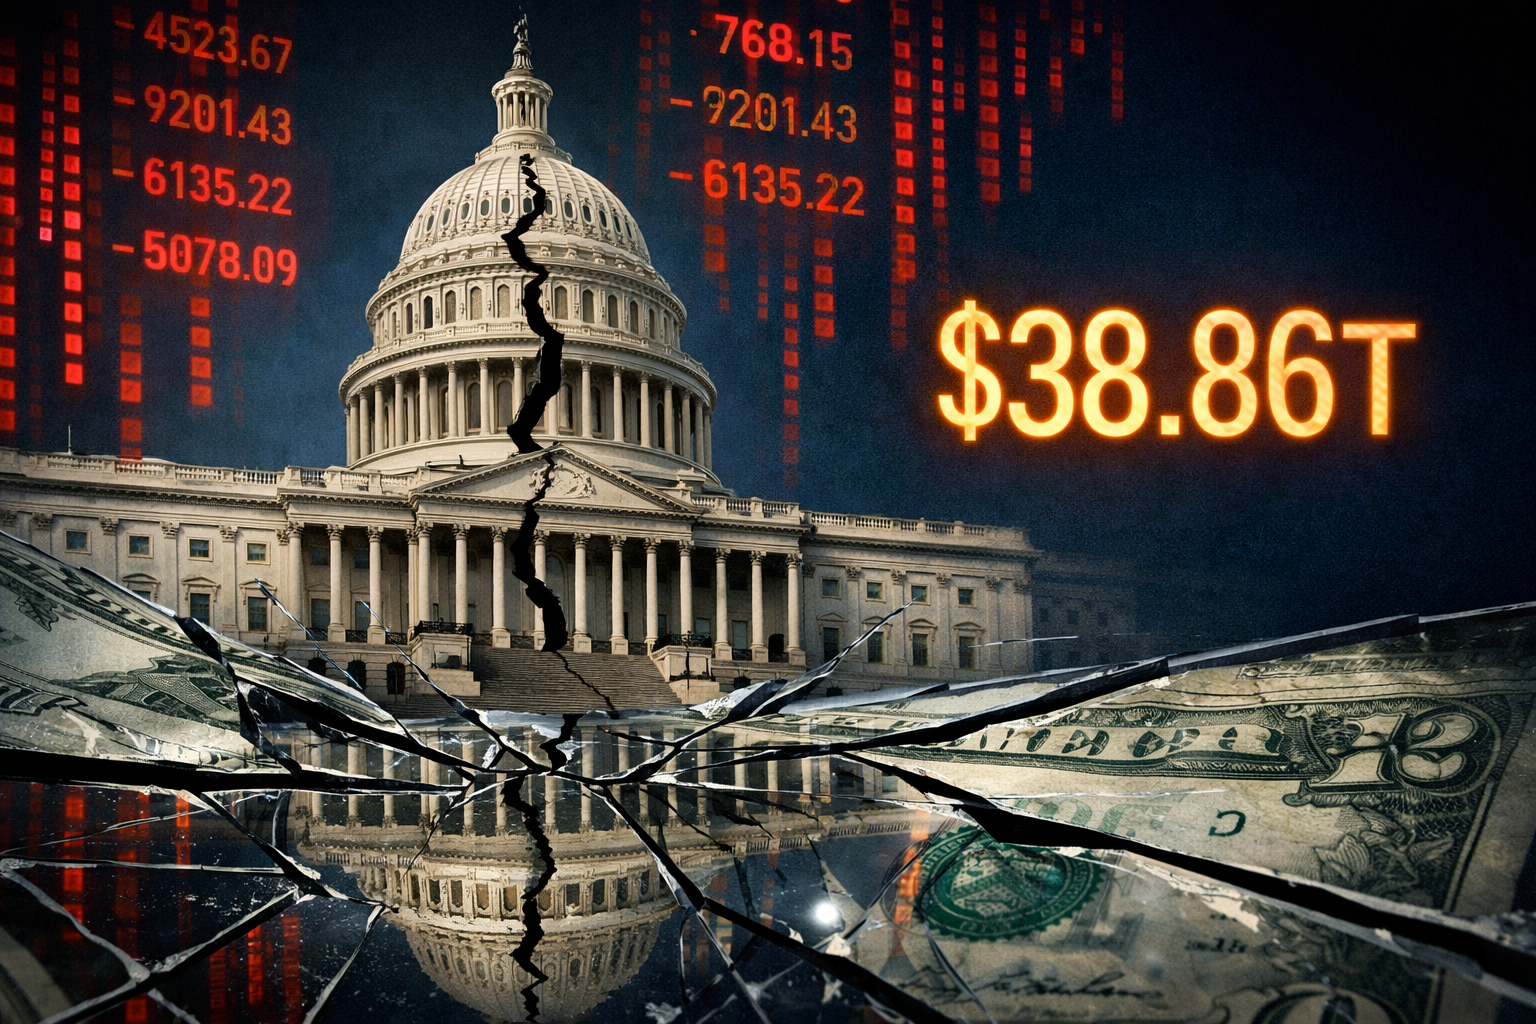
Also Read: U.S. Debt Interest Hits $1 Trillion, Now Outpaces Entire Defense Budget
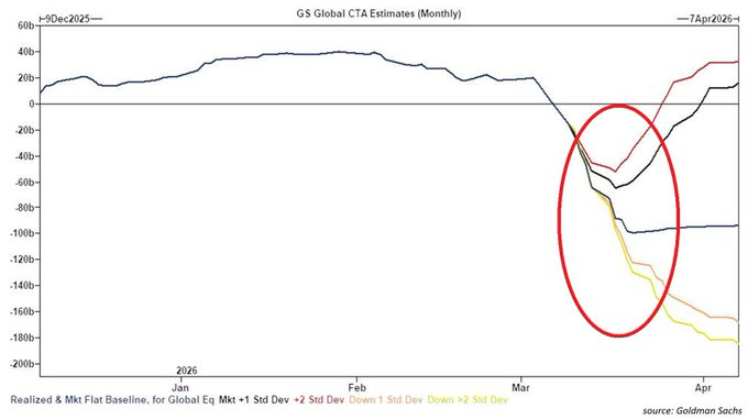
The selling pressure goes beyond options markets. Systematic funds plan to sell equities in every possible scenario over the coming week, and Goldman Sachs describes the sell estimates as “some of the largest on record.”
Global Markets Investor had this to say:
“CTAs are set to sell -$66 billion on a flat tape, -$35 billion on an up tape, and -$87 billion on a down tape.”
With put options demand and systematic selling both at extremes, the natural question is whether this is a warning or a setup for a sharp reversal. On the contrarian side, similar levels of market crash hedging were recorded near bottoms in previous selloffs.
Global Markets Investor clarified:
“Those mentioned were recorded near bottoms, so more a contrarian. However, this can still go lower along with the market. This indicates that short-squeeze risk is rising if any positive news appears.”
S&P 500 volatility is likely to remain elevated until a clear macro catalyst shifts the positioning.
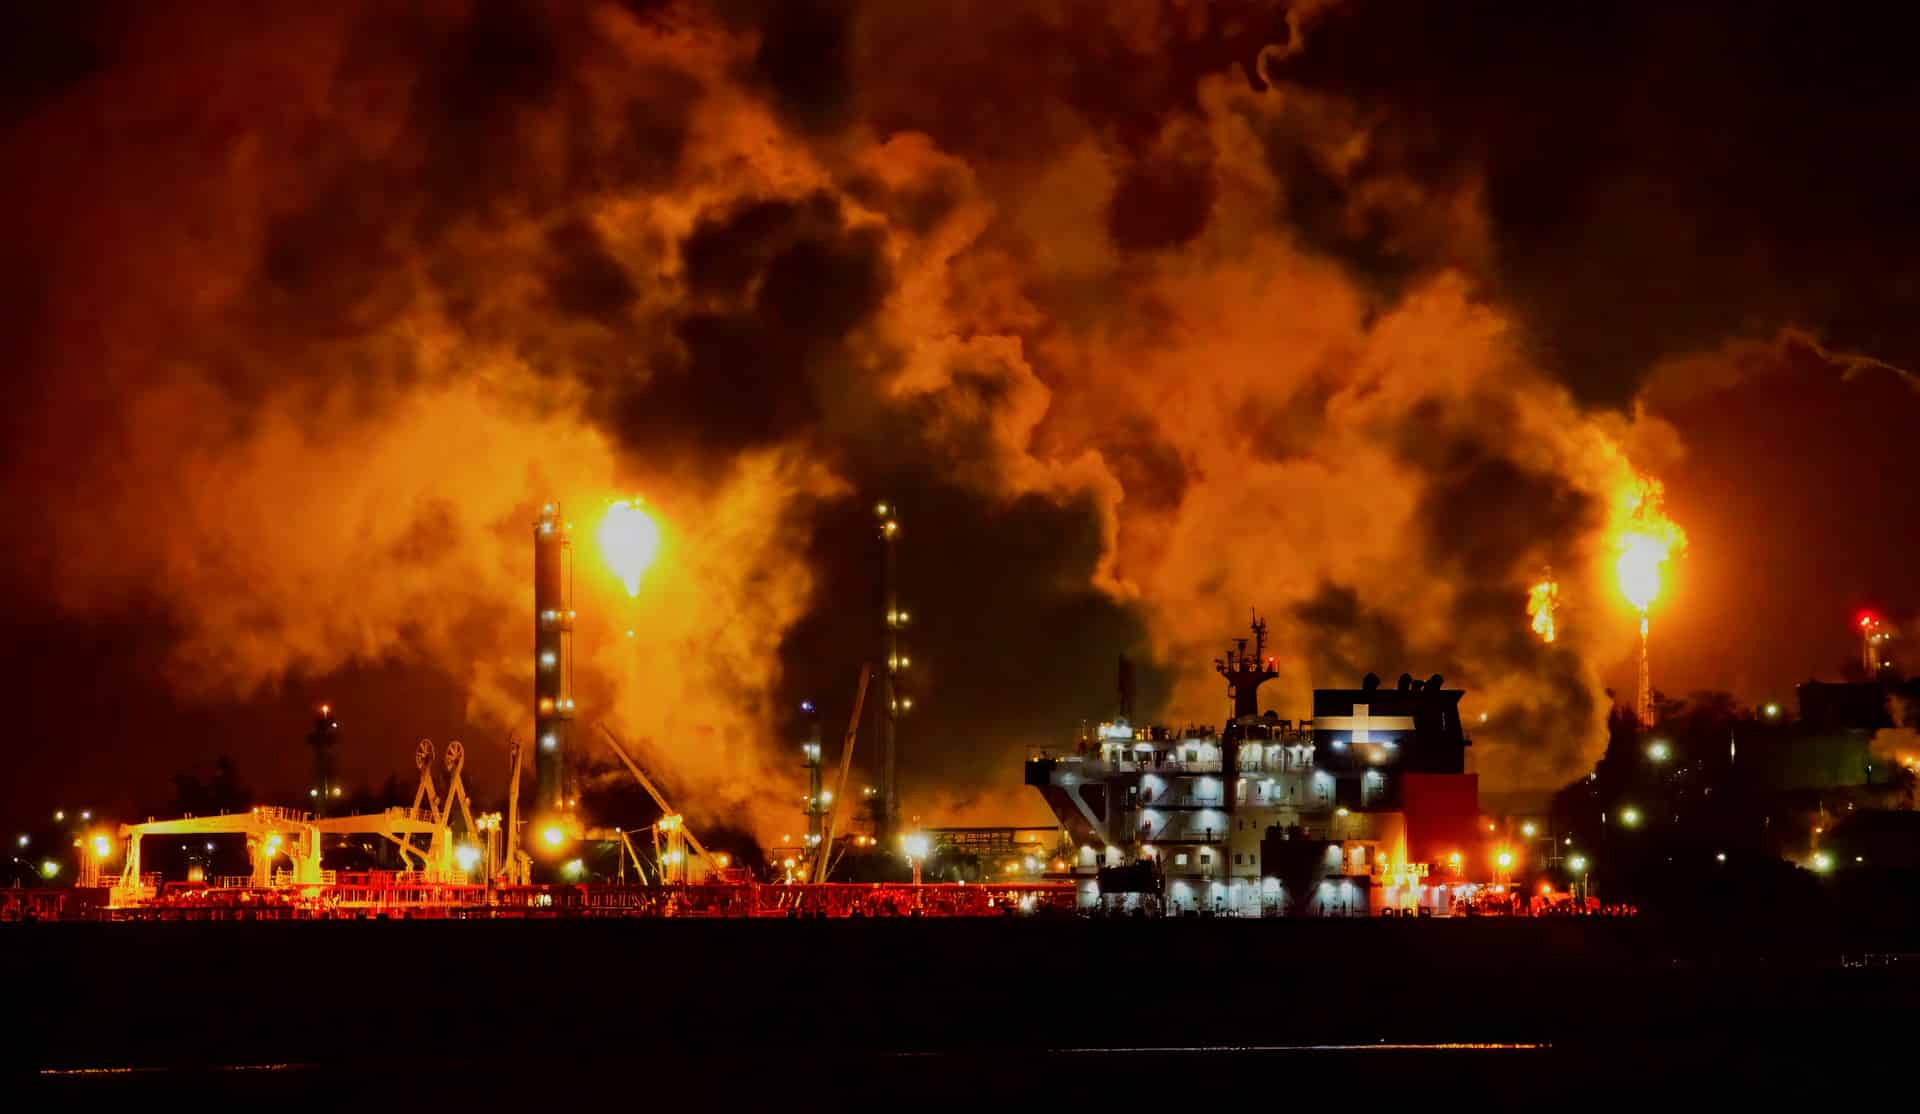
Also Read: Oil Jumps Past $100 as 400M‑Barrel IEA Release Fails Amid Hormuz Disruption