


Markets
July 15, 2026
Trump’s Worst Crypto Nightmare? Japan Just Cleared the Way for Bitcoin ETFs

The Fed balance sheet grew again last week, reaching its highest level since March 2025. Meanwhile, new data showed the US wealth divide continuing to widen. Both these developments tell different stories. But they seem to be offering another perspective of an economy where Federal Reserve assets are expanding, even as consumer spending becomes increasingly concentrated among higher-income households.
Also Read: Meta Builds Prediction Markets App as Cboe Launches First Forecasting Product
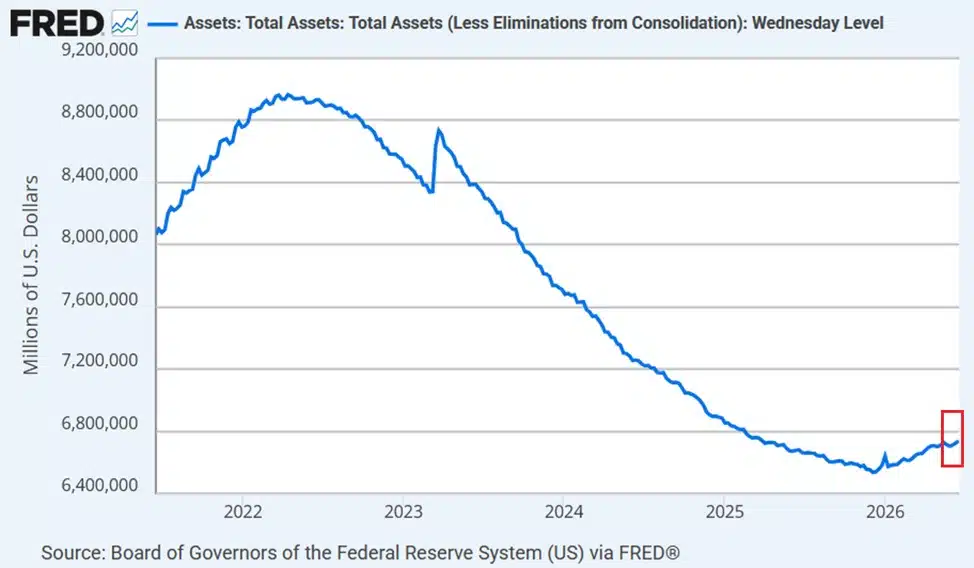
The Fed balance sheet increased by $11 billion in the week ending June 17 to $6.74 trillion, according to data from the Federal Reserve Economic Data (FRED). Since the start of the year, Federal Reserve assets have grown by about $162.8 billion.
Much of this increase came from Treasury holdings, which rose by $251.8 billion to $4.49 trillion. This is their highest level since June 2024. Meanwhile, the Fed continued to reduce its mortgage-backed securities portfolio. These holdings fell to $1.96 trillion, the lowest level since September 2020.
The latest figures leave the Fed balance sheet at its largest size in more than a year. This is even if it remains below the record levels reached during the pandemic.
Also Read: Nvidia’s AI Chips Double in Price in China as It Tackles AI’s Water Problem
While the Fed balance sheet has been moving higher, spending patterns suggest the gains across the economy remain uneven. Data shared by The Kobeissi Letter points to another long-running trend. The US wealth divide has become more visible in consumer spending.
According to the figures, the top 20% of earners now account for about 58% of personal spending in the US. This is the highest share on record. The bottom 80% account for the remaining 42%, the lowest on record. In the 1990s, both groups contributed roughly half of the total spending.
Since 2020, spending by the top income group has grown by an average 8.3% a year, compared with 4.5% for the bottom 80%. Over the past year, spending among higher-income households rose 6.5%, versus 2.6% for everyone else.
The numbers do not really suggest that a larger Fed balance sheet directly caused wealth inequality. They do, however, point to an economy where Treasury holdings and other Federal Reserve assets continue to rise while consumer spending is increasingly driven by a smaller share of households. That’s likely to remain an important theme as investors assess the strength of the US economy in the months ahead.
Also Read: CryptoQuant Urges Strategy to Pause Bitcoin Buying as Cash Reserves Fall 38%

Written by Sahana Kiran
Sahana Kiran has been covering financial markets since 2019, with a focus on cryptocurrencies, fintech, and the geopolitical events shaping them. She previously reported for AmbCrypto and Watcher Guru, and now writes for BlockNow.