


Markets
June 4, 2026
Coinbase Launches SpaceX Pre-IPO Trading as Space ETF Assets Top $5 Billion
Key Takeaways
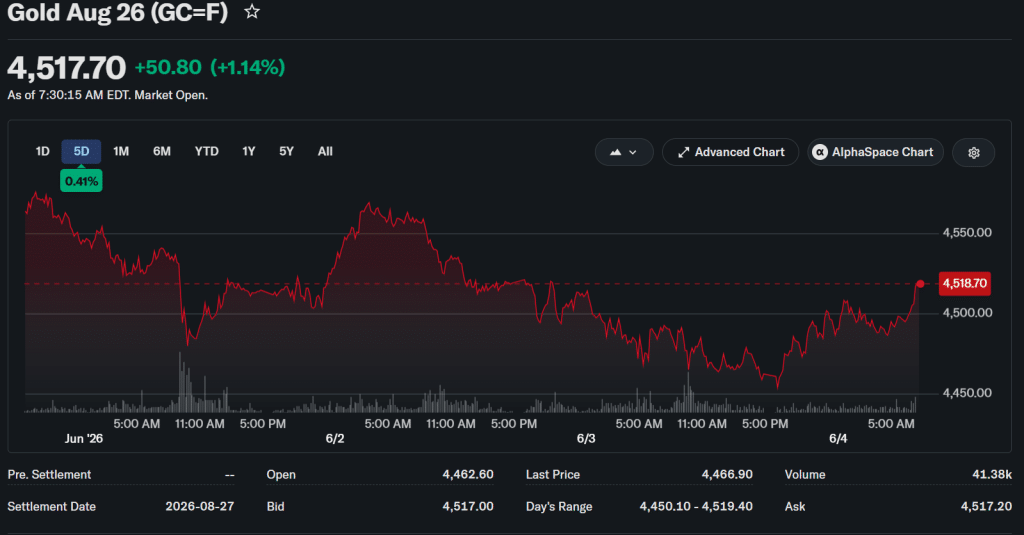
Gold price is down roughly 20% from its all-time high of $5,589, hit on January 28, 2026. As of June 4, the gold price for today sits around $4,477 and every major bank on Wall Street is pointing at the same thing: a buying opportunity. JPMorgan targets $6,300 by year-end. Wells Fargo sees $6,100 to $6,300. Bank of America and Deutsche Bank both hold $6,000 targets. Goldman Sachs, the most conservative, targets $5,400, still 20% above where gold trades right now. UBS cut its near-term target to $5,200 for June but views the pullback as a consolidation phase, not a structural break, and still expects $5,900 by December.
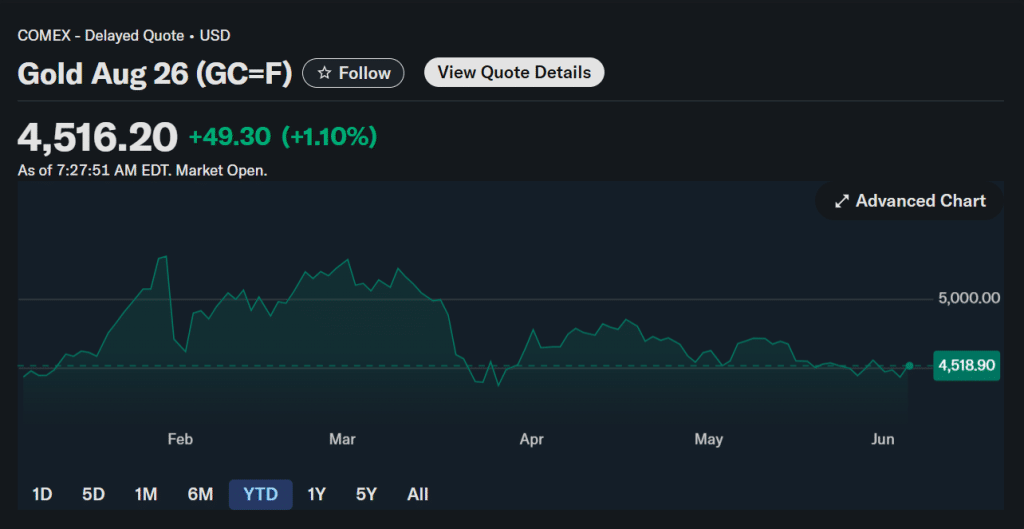
The correction was driven by Iran war inflation fears pushing rate expectations higher and strengthening the US dollar. For anyone looking at the gold price prediction heading into H2 2026, the institutional view is unusually uniform: the structural bull case is intact, and JPMorgan’s gold forecast, the most bullish on the Street, sees current prices as the setup for the next leg higher.
Also Read: XRP Price May Reach $40 by 2035, While XRPL Passes $400M in Tokenized Assets
The Iran war, which escalated in late February 2026, created a paradox for the gold price. Rising oil prices pushed inflation expectations sharply higher, which prompted markets to price out Fed rate cuts and assign roughly 50% probability to at least one rate hike by year-end. Higher-for-longer real yields strengthened the dollar, and those are gold’s two biggest headwinds. Gold shed more than 10% in March alone, its worst monthly decline since June 2013.
Goldman Sachs analysts Lina Thomas and Daan Struyven addressed the selloff directly. They wrote:
“Gold’s medium term outlook remains intact and the precious metal may reach $5,400 an ounce.”
They also added that the repricing had “overshot, reflecting an over-emphasis on the inflation channel relative to the growth drag,” and that history shows growth concerns eventually dominate. Goldman also flagged that concerns some central banks might sell gold to support their currencies are “unlikely to materialize,” noting Gulf countries are more likely to intervene by liquidating US Treasuries since they “typically operate dollar pegs.”
The gold price today is also being shaped by what JPMorgan is watching most closely: the Strait of Hormuz. The bank’s base case sees the gold price recovering to $4,900 to $5,100 on ceasefire progress, then continuing toward $6,300 by year-end.
JPMorgan stated:
“We remain firmly bullishly convicted in gold over the medium-term on the back of a clean, structural, continued diversification trend that has further to run amid a still well-entrenched regime of real asset outperformance vs paper assets.”
The gold price prediction from every major institution rests heavily on central bank demand, and the numbers here are significant. Goldman Sachs revised its internal tracking model in May 2026 after finding it had been undercounting purchases since August 2025. The revised figure shows central banks acquired 66 tonnes in January 2026 alone, versus a prior estimate of just 12 tonnes. Goldman now expects purchases to average 60 tonnes per month through the rest of the year.
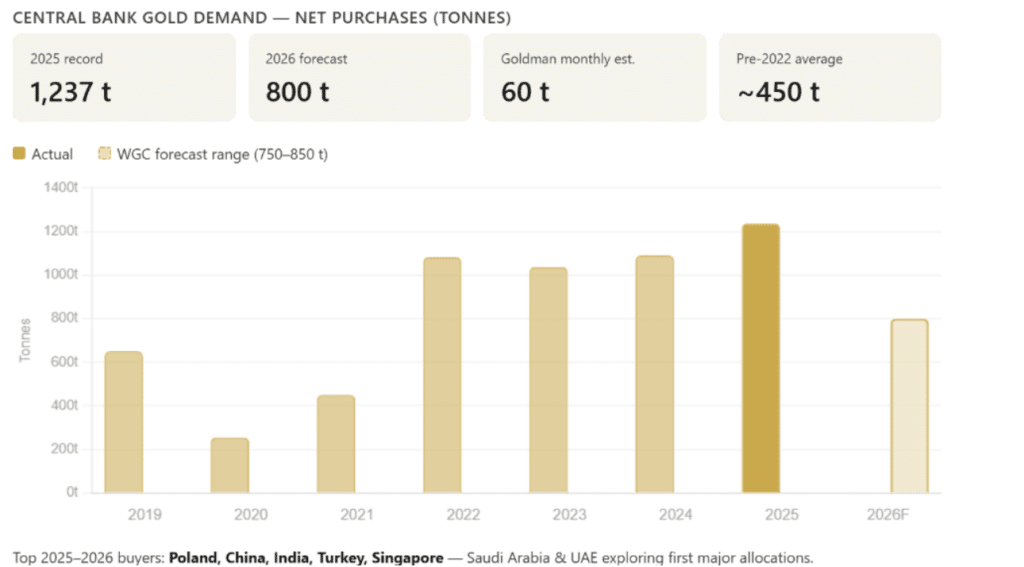
JPMorgan forecasts full-year 2026 central bank buying at 800 tonnes. UBS expects 950 metric tonnes of official-sector purchases. Poland raised its gold holding target to 700 metric tonnes from 550, a shift UBS highlighted as significant because it signals reduced price sensitivity from one of the market’s largest buyers. The pre-2022 average was around 450 tonnes per year. After Russia’s foreign currency reserves were frozen in 2022, sovereign governments drew a clear conclusion about the risks of dollar-denominated assets, and that structural shift is still playing out in the gold price today.
Also Read: Stripe, Visa, and Mastercard’s New Stablecoin Could Kill Circle’s $2.64B Revenue
The Federal Reserve cut rates three times in late 2025, bringing the federal funds rate to 3.75%. The additional cuts Goldman had forecast for early 2026 did not happen as Iran-driven inflation repriced expectations. Moody’s recession model put the odds of a US downturn at 49% based on February data, before the full impact of the Iran war was priced in. Markets are now assigning roughly 50% probability to a rate hike by year-end, a stark reversal from January.
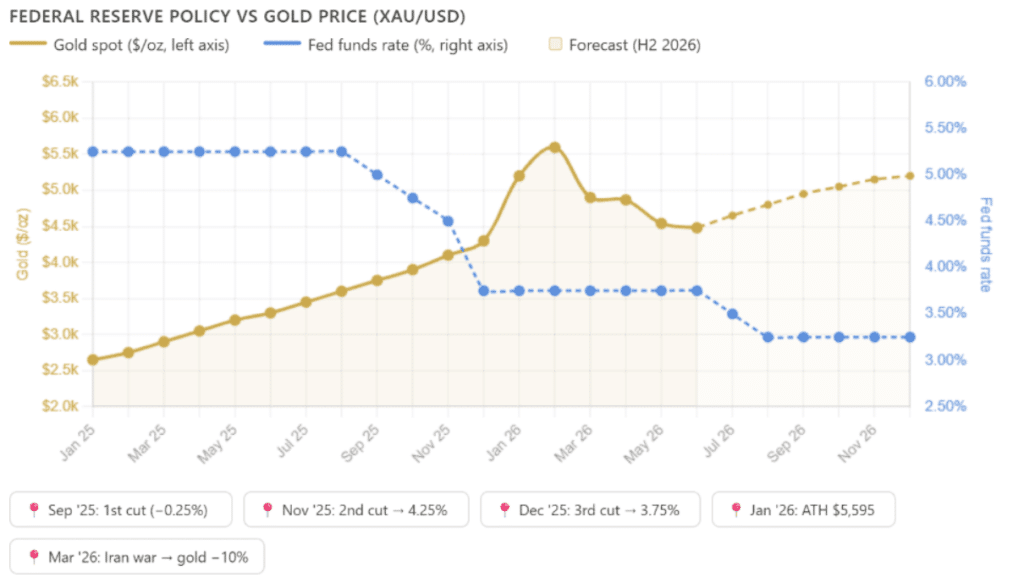
Goldman Sachs has put a number on what Fed policy means for the gold price: every 50 basis points of easing adds approximately $120 per ounce of price support. If two cuts materialize in H2, that is around $240 per ounce of upside from rate dynamics alone. UBS strategists led by Mark Haefele wrote:
“While higher real yields and a stronger USD may cap near-term gains, we view recent weakness as temporary rather than a structural shift.”
They also noted that gold “does not always rally during periods of geopolitical conflicts,” but that the traditional drivers, falling real yields, increased liquidity, and rising uncertainty, should return, making gold “a deferred, rather than a failed, portfolio hedge.”
Gold ETFs recorded $72 billion of global inflows in 2025, a full-year record. Despite the H1 2026 correction, ETF flows remained resilient. One week in May saw 240,000 oz of inflows even as the gold price fell 3.7%. Morgan Stanley estimates gold currently represents just 0.17% of US private financial portfolios, well below the 2012 peak. The bank calculated that every 1 basis-point increase in that allocation share would add approximately 1.4% to the gold price purely from demand flow.
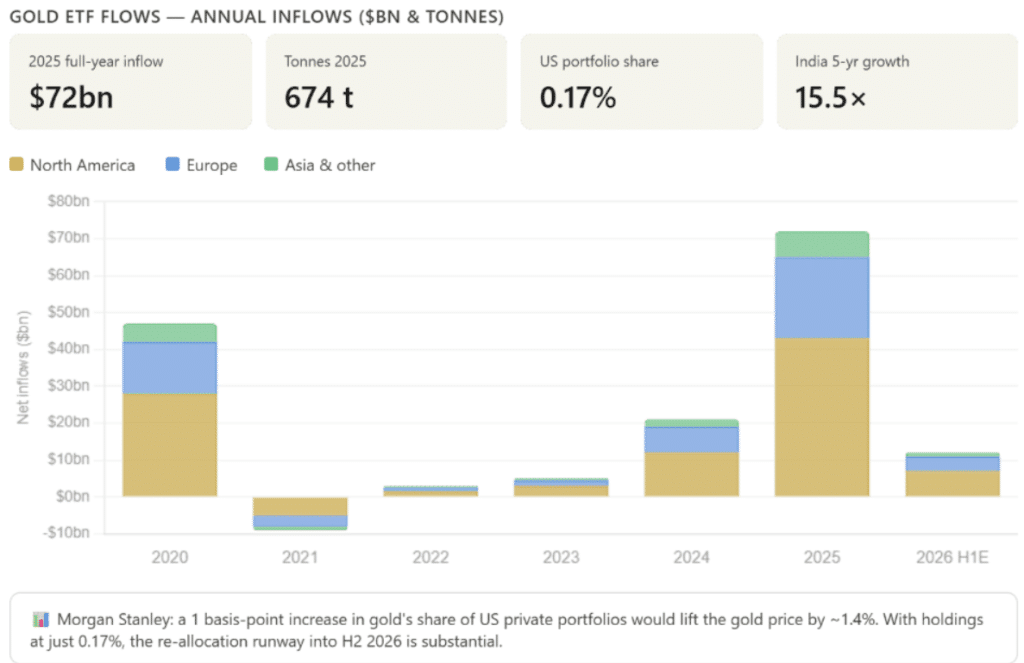
That re-allocation runway is one of the core reasons analysts say to buy gold in 2026 rather than wait. If the Fed signals a cut and the dollar softens, institutional money moving back into gold ETFs could be the engine of a Q3 to Q4 rally toward the $5,400 to $6,300 range the banks are targeting in their gold price predictions.
Gold is consolidating between $4,423 to $4,466 medium-term support and the $4,546 to $4,620 resistance zone, which marks the top of the descending channel and the 200-period SMA cluster. Bulls defended the $4,423 to $4,466 zone in late May. The critical level below is the 200-day SMA at $4,300 to $4,320, the line that separates a bull market correction from something more serious.
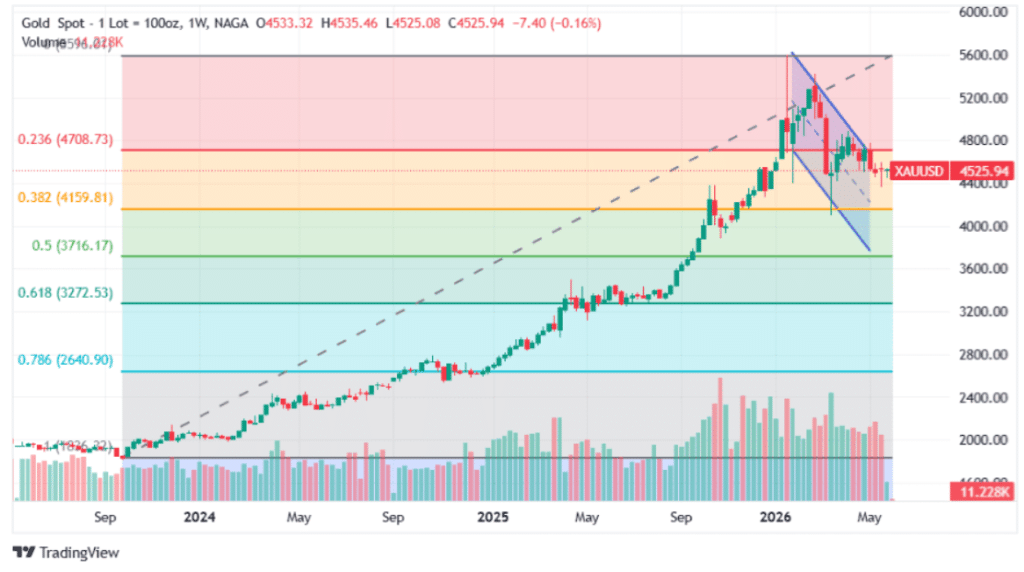
A daily close above $4,620, accompanied by a catalyst such as ceasefire progress, softer payrolls, or a dovish Fed signal, could open a move toward $4,730 to $4,800 and then the psychological $5,000 level. The bear scenario, a break below $4,300, would open a test toward $3,800. Gold is still up 31% over the past 12 months and 135% over five years. The trend has not broken. JPMorgan’s gold forecast of $6,300 remains the most aggressive on the Street, but even Goldman’s most conservative gold price prediction of $5,400 represents a 20% gain from where the gold price sits today.
Also Read: House Voted 215-208 to End Iran War as US Oil Hit Its Lowest Since 2004