


Markets
July 25, 2026
China Gold Market Shift Forces Banks to Suspend Retail Paper Trading
Key Takeaways
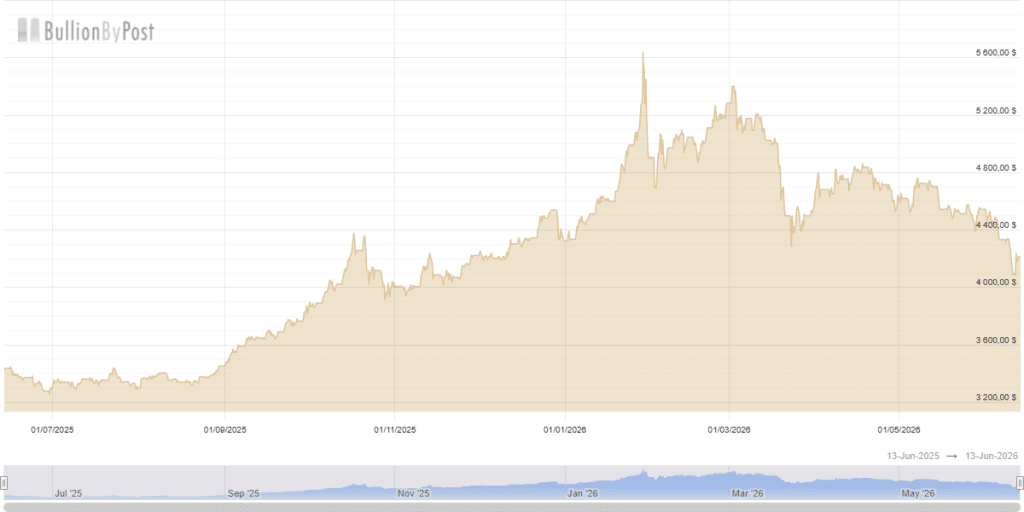
Gold prices plunged 25% from a record $5,634 at the end of January 2026 to $4,211.29 on June 12, while silver suffered an even steeper decline nearing 50%. This sharp gold price drop and silver market crash stem from persistent inflation driven by the Iran war, surging oil prices, hotter-than-expected U.S. jobs data, and rising expectations of Federal Reserve rate hikes. Investors shifted from non-yielding metals to higher-yield assets amid a stronger dollar, sparking paper market liquidations in this mid-bull correction.
Also Read: Oil Price Volatility Continues Amid Iran US Negotiations
Gold prices have fallen sharply from their record peak. The metal hit an all-time high of $5,634 per ounce at the end of January 2026. On June 12, 2026, spot gold traded at $4,211.29. This represents a significant gold price drop of exactly 25%.
Several factors triggered this steep decline. Persistent Fed rate hike fears gained strength after hotter-than-expected U.S. inflation data. Surging energy costs from the Iran war pushed May CPI and PPI readings higher. Strong jobs numbers further reinforced expectations that the Federal Reserve may hold rates steady or even increase them later this year.
These developments lifted real yields and strengthened the dollar. Both elements pressured non-yielding assets like gold. Investors rotated out of precious metals toward higher-yielding alternatives. Paper market positions faced heavy liquidations as margin calls spread.
Analysts describe this gold price drop as a classic mid-bull market correction. Central banks continued selective physical buying even amid the weakness. Technical indicators showed broken support levels. Traders now watch key zones near $4,000 for potential stabilization.
As reported by Blocknow, this precious metals decline erased all 2026 gains for gold so far despite large purchases by some central banks.
Also Read: US Forces Anthropic Suspension of Fable 5 & Mythos 5 Over Security Concerns
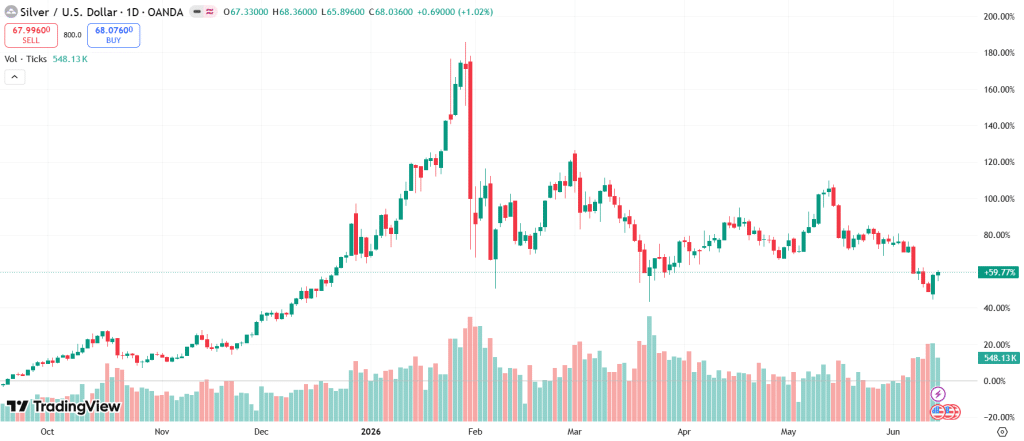
Silver prices have experienced a brutal sell-off in recent months. The white metal reached an all-time high near $121.64 per ounce at the end of January 2026. By June 12, 2026, silver traded around $67 per ounce. This sharp move amounts to a wipeout of nearly 50% from its peak.
The silver market crash intensified due to amplified industrial sensitivities and leveraged position unwinds. Heavy selling hit paper markets as traders faced margin pressures amid shifting sentiment. Industrial users in solar, EVs, and electronics temporarily stepped back while seeking cost alternatives.
This precious metals decline hit silver harder than many other assets. Heightened Fed rate hike fears reduced appeal for the metal despite its dual monetary and industrial role. Ongoing Iran war impact created mixed signals through energy volatility that complicated demand forecasts.
Analysts view the gold price drop and silver weakness as interconnected elements of the same correction phase. Yet silver’s greater volatility stems from its larger industrial exposure. Supply deficits persist according to the Silver Institute, while traders monitor support levels for signs of stabilization. Market participants now assess whether this crash offers a long-term entry point.
Also Read: ECB Rate Hike First Since 2023 as Inflation Hits Highest Level in Almost 3 Years

Written by Carlos Terenzi
Carlos Terenzi is a financial analyst with over 10 years of experience in crypto, finance, and international relations, focusing on Bitcoin, monetary policy, and precious metals.