


Business
July 12, 2026
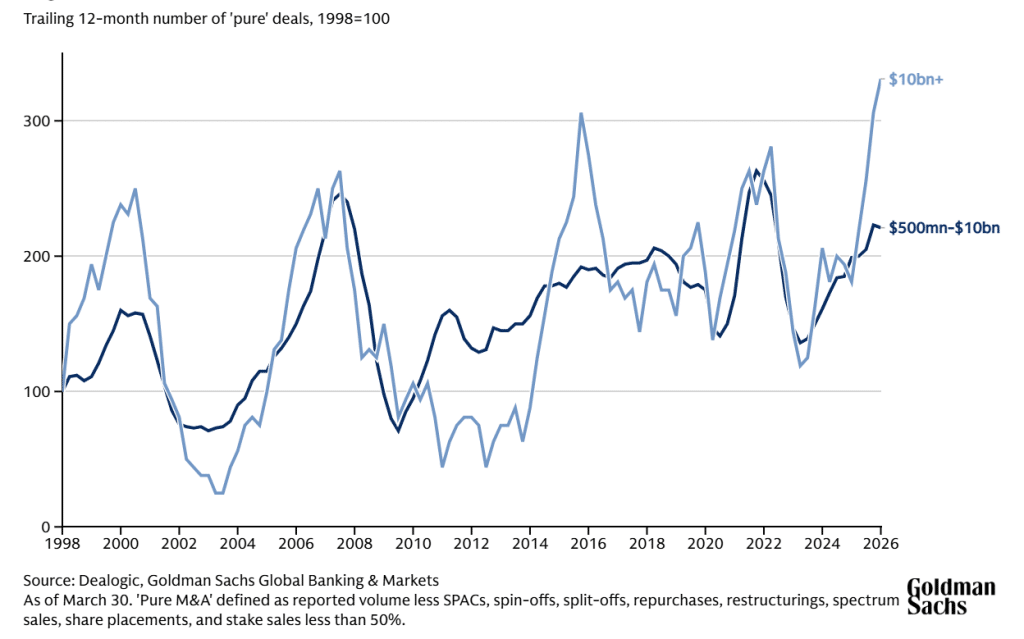
Strong JPM Q2 Earnings Expected Amid Robust Investment Banking Fees
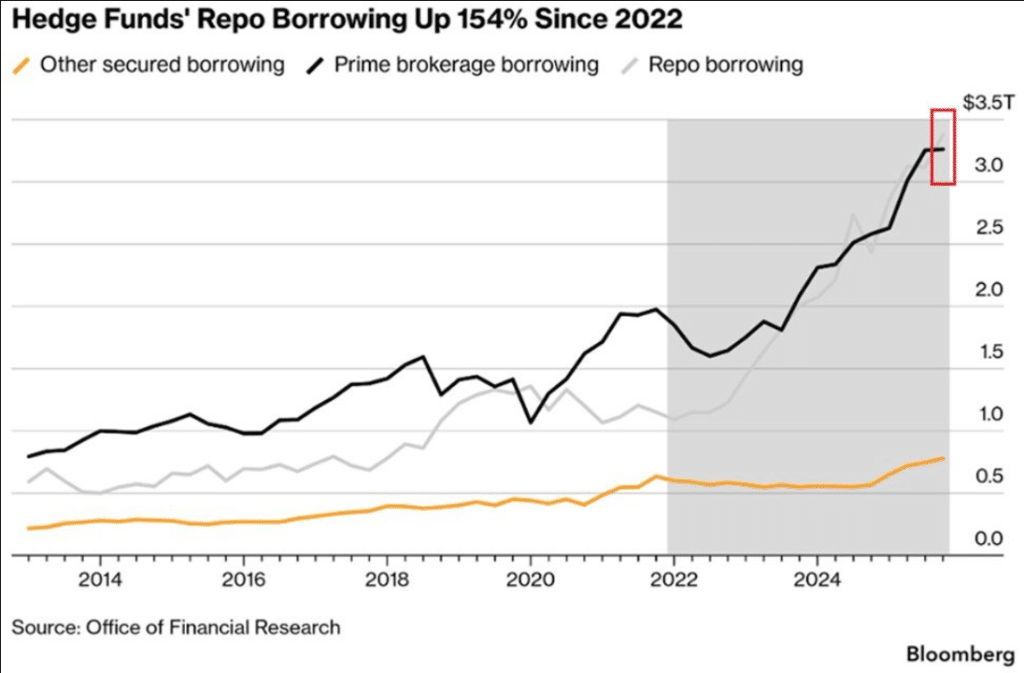
Goldman Sachs stock market analysis reveals pension funds are set to dump approximately $25 billion in equities by the end of April, the largest non-quarterly sell estimate since 2000. Meanwhile, hedge fund repo leverage has hit a record $3.4 trillion, tripling since 2019 in a setup that mirrors the March 2020 market crash.
The pension fund selling happens mechanically, regardless of market conditions. This rebalancing was triggered by the S&P 500’s 8.95% total return versus bonds’ 0.79% gain, creating an 8.16 percentage point gap. The $25 billion figure is roughly 12 times the historical monthly average and ranks among the top 15 largest sells Goldman Sachs stock market desk has tracked in 25 years.
Also Read: Trump Rejects Iran Deal, Extends Hormuz Blockade as Gas Hits $4.12 and 80% Cut Spending
John Flood, head of Americas equities execution services at Goldman Sachs, warned clients about multiple red flags. Hedge funds executed their biggest deleveraging in seven months last week, trimming both long and short positions.
The repo leverage situation poses systemic risk. Hedge funds now control approximately 8% of the $31 trillion US Treasury market, up from just 3% in 2021. Prime brokerage borrowing doubled to $3.2 trillion since 2022.
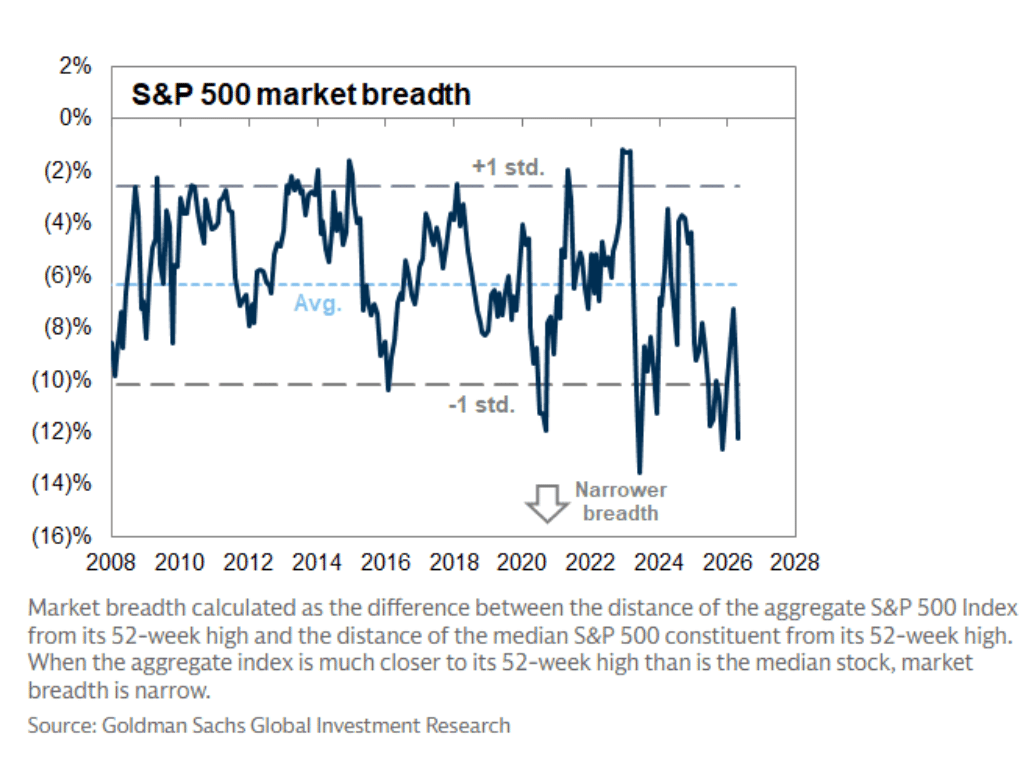
Systematic trend-following funds bought $53 billion in equities over the past month but are no longer net buyers. The S&P 500 hit a record high Friday, yet 324 of its components closed lower, producing a net breadth reading of negative 148.
Flood had this to say:
“This tape continues to have bad breadth.”
The Philadelphia Semiconductor Index closed 50% above its 200-day moving average, matching extremes last seen in 2000 before that market crash unfolded.
Also Read: UAE Leaving OPEC After 60 Years, Targets 5M Barrels/Day by 2027 vs 3.4M Quota
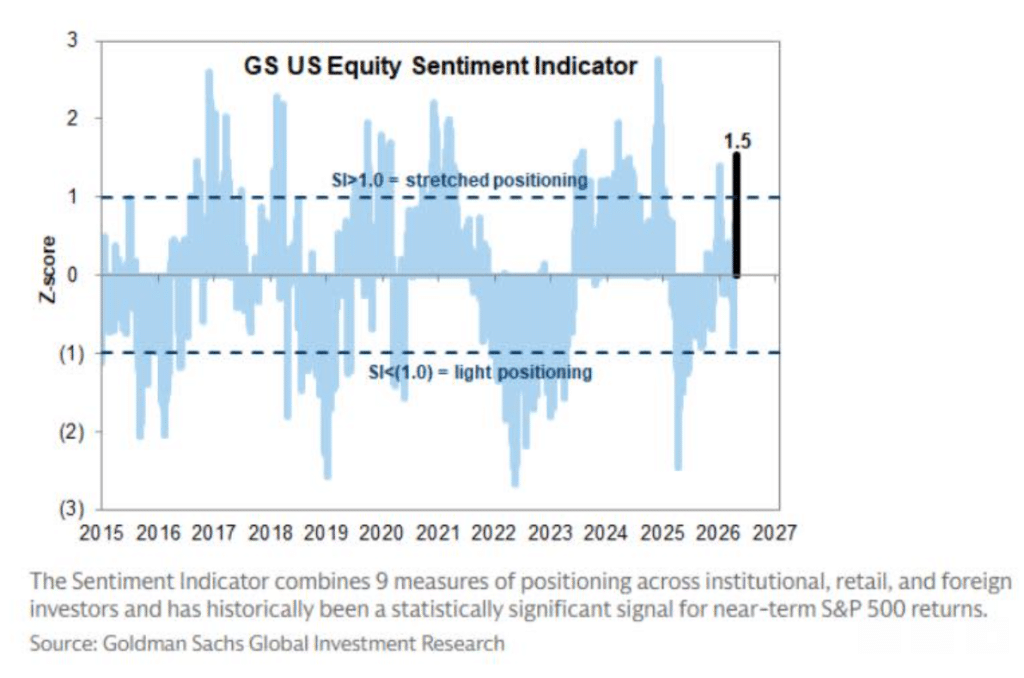
Goldman Sachs stock market sentiment indicators show positioning in “stretched” territory. The firm’s equity sentiment indicator combines nine measures across institutional, retail, and foreign investors.
Brian Garrett, a Goldman trader, noted in a weekend memo that hedge funds’ net exposure “remained relatively restrained throughout the year, within a range of plus or minus 53%,” calling it prudent risk management given current uncertainty.
Apollo warned that sudden spikes in borrowing costs or volatility could force rapid unwinding of leveraged positions, triggering heavy Treasury selling and broader bond market stress similar to the 2020 market crash scenario.
Also Read: Central Banks Hold $4T in Gold vs $3.9T in US Treasuries First Time Since 1996
Despite the warning signs, Flood advised clients that any pullback “should be used as a buying opportunity” and expects the S&P 500 to finish 2026 significantly higher. This week brings earnings from 44% of the index’s market cap, including Alphabet, Meta, Amazon, and Apple.

Written by Vladimir Popescu
Vladimir Popescu leads editorial coverage at BlockNow, with over 8 years in financial and tech journalism. He previously held editorial leadership roles at Watcher Guru and Windows Report, and has been cited by Forbes for his crypto market coverage.