


Markets
July 21, 2026
Trump Tariffs Hit Canada at 50% Under a Law Never Used Before, and 60 Countries Are Next
Key Takeaways:
The Hindenburg Omen, the technical indicator that correctly called both the 1987 and 2008 stock market crashes, triggered for the third consecutive day on June 9, firing at the same time on both the NYSE and the Nasdaq. As CoinPedia reveals, three back-to-back readings form the most reliable cluster signal that has historically preceded the indicator’s most significant warnings. The last confirmed cluster appeared in February 2026, just weeks before markets rolled into the sharp March decline.
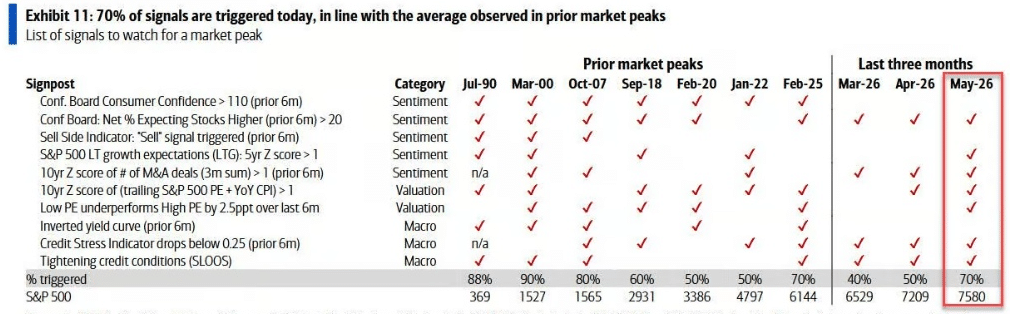
At the time of writing, Bank of America also added its own warning to the mix, with 70% of its indicators now active and the bear market 2026 conversation getting harder to dismiss. A stock market crash 2026 scenario no longer feels hypothetical as the S&P 500 sits at levels that raise real questions about an S&P 500 crash, on eight separate valuation metrics trading above what the market hit right before the dot-com bubble burst.
Also Read: China Plans $295B AI Data Center Buildout as Race With US Intensifies

On June 5, Bank of America strategist Savita Subramanian put out a note telling investors to take profits. The firm tracks ten bear-market indicators across sentiment, valuation, and macro conditions, and seven of those ten now show warning signs. That is a 70% reading, and with a bear market 2026 scenario now circulating across Wall Street desks, the timing of this cluster is hard to ignore. As TradingKey reveals, this figure is comparable to seven S&P 500 market tops since 1990, making it one of the clearest warning clusters the bank has flagged in years.
Two of the indicators triggered in May alone, and five had already fired in April. Savita Subramanian, BofA strategist, stated:
“Too many red flags.”
The S&P 500 looks statistically expensive on 17 of 20 valuation metrics the bank tracks. On eight of those metrics, it actually trades above levels from the dot-com bubble era. TradingKey draws the comparison even sharper, noting the current setup resembles conditions seen roughly one month before the 2000 bubble burst. That is a hard number to wave off. TradingKey also reports that AI hyperscaler capital expenditure could eat up nearly 100% of operating cash flow by year-end, a jump from just 40% back in 2023. Cash flow conversion has flattened, and buybacks as a share of market cap also slowed down meaningfully since BofA’s November 2025 analysis.
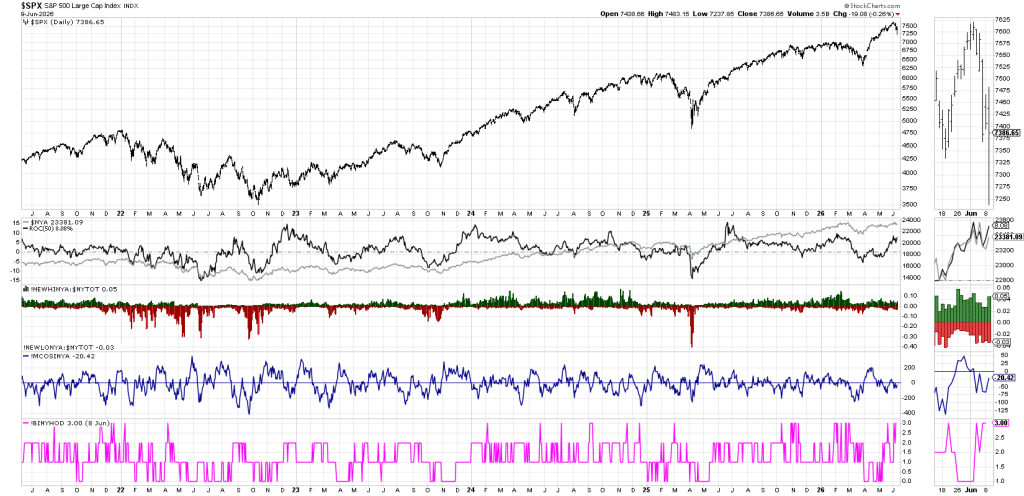
The chart below captures the performance gap inside the S&P 500 right now, with the top 10% of stocks outperforming the bottom 10% by about 65 percentage points over the last three months, the widest spread since 2008.
BofA’s year-end S&P 500 target sits at 7,100, which puts potential downside at roughly 4 to 6% from current levels. This is a profit-trimming call, not an S&P 500 crash prediction, and certainly not a stock market crash 2026 forecast. The firm also pointed to financials, healthcare, and consumer discretionary as rotation targets, sectors that carry lower valuations and have actually been down year-to-date, unlike the AI and semiconductor names propping up the index.
Also Read: OpenAI Confidentially Files for IPO as Traders Bet on $1.5T Valuation
Monday’s session hit hard across every asset class. S&P 500 crash fears were back on the table fast. The S&P 500 dropped 1.62%. The Nasdaq fell 2.50%. The Russell 2000 shed 2.06%. Gold slid 1.95% and silver took the sharpest hit, down 5.56%. Bitcoin dropped too, moving from $64,100 down to $61,600, part of a broader Bitcoin decoupling from AI stocks that has been intensifying, pushing roughly $451 million in liquidations through the market.
Total crypto liquidations over 24 hours came in at around $1.1 billion, and the Hindenburg Omen cluster was sitting in the background through all of it, exactly the kind of session that keeps the bear market 2026 debate alive. By the June 9 close, the Nasdaq finished down 0.97% and the S&P 500 ended down 0.26% on the day, which tells you the real damage happened intraday and got partially walked back before the bell.
Two theories circulated about what drove the selling. The first points to the SpaceX IPO facing China ban but presses ahead on June 12. Retail investors sold existing positions to raise cash for the listing, and institutions trimmed ahead of forced index buying when QQQ funds must automatically purchase SPCX in July, following Nasdaq’s revised inclusion rules. The second theory is simpler: when every asset class sells off together, it tends to mean larger players know something the rest of the market does not know yet.
After BlackRock reclaimed top Bitcoin holder status with a $900 million buy, its holdings then declined, dropping from a peak of 823,000 BTC down to roughly 779,000 BTC, a cut of around 44,000 BTC. On June 10, the firm’s ETF sold $61,640,000 in Bitcoin, according to data flagged by Ash Crypto on X:
A $43 million sell wall placed by Binance whale orders also sits right at $65,000, and the next major resistance zone traders watch closely is near $80,000.
Also Read: Nvidia and SK Hynix Sign Multiyear AI Deal Ahead of Vera Rubin Launch
Morgan Stanley still puts the S&P 500 at 8,000 by year-end. Some desks treat the recent tech selloff as a buying opportunity, pointing to corporate earnings and AI capital expenditure as ongoing support. Citi’s own bear-market checklist shows risk signals at their highest point since 2008, though not yet at the extremes that historically come right before a full bear market 2026 scenario. Its recommendation stops short of telling investors to abandon dip-buying.
The Hindenburg Omen has produced false positives before, and BofA stops well short of predicting an S&P 500 crash. Its year-end target of 7,100 implies selective trimming, not full liquidation. What makes the current setup harder to dismiss is the sheer number of things converging at once:
The tornado siren is sounding. Whether the tornado actually hits is a different question entirely.

Written by Vladimir Popescu
Vladimir Popescu leads editorial coverage at BlockNow, with over 8 years in financial and tech journalism. He previously held editorial leadership roles at Watcher Guru and Windows Report, and has been cited by Forbes for his crypto market coverage.