


Markets
July 26, 2026
Meta Q2 Earnings Spotlight Shifting Monetization Strategies for Mark Zuckerberg
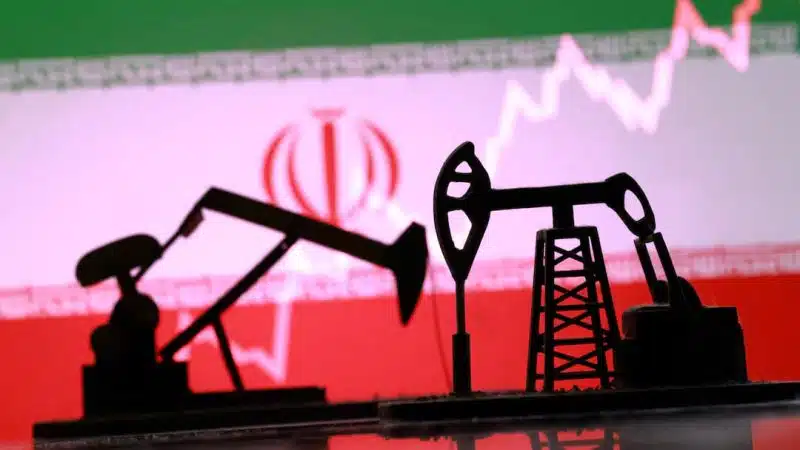
The Iran war is entering what may be its most consequential week since fighting began on February 28. President Donald Trump told Fox Business host Maria Bartiromo on April 14 that the US-Israeli conflict with Iran is “very close to over”, and markets moved hard on those words. Oil prices dropped, Bitcoin price pushed above $75,000, and gold price held near multi-year highs as traders priced in a deal.
| Scenario | Likelihood | Description | Oil (Brent) | Macro and Policy | Market Impact |
|---|---|---|---|---|---|
| Best case – full deal | Low to medium | Full agreement reached, blockade lifted, energy flows normalize gradually | Falls to $70 to $75 | Inflation pressure eases, Fed less hawkish | Relief rally, Bitcoin targets $85K to $90K, gold stays elevated |
| Middle case – partial deal | High | Ceasefire holds, partial reopening, sanctions remain, risk premium lingers | Stabilizes $85 to $90 | Sticky inflation, Fed cuts drift to late 2026 | Choppy markets, Bitcoin range-bound $68K to $75K, gold holds above $5,000 |
| Worst case – talks collapse | Medium | Blockade holds, shipping disrupted, energy shock deepens | Back above $100 | Stagflation risk rises, Fed stuck between inflation and recession | Recession priced in, Bitcoin tests $68K with risk to $55K, gold breaks $5,500 |
Note: We break down each asset class in detail later in the article. This table is the quick overview.
The trouble is that markets have been here before. The April 8 ceasefire was met with a 7% surge in silver and an oil crash, and collapsed 12 days later after talks in Islamabad failed after 21 hours of negotiations. Trump has now signaled a fresh round of talks could restart in Pakistan within days. Here is what happens to every major asset class under each outcome.
Also Read: The Pattern Day Trader Rule Is Dead and You Now Only Need $2,000

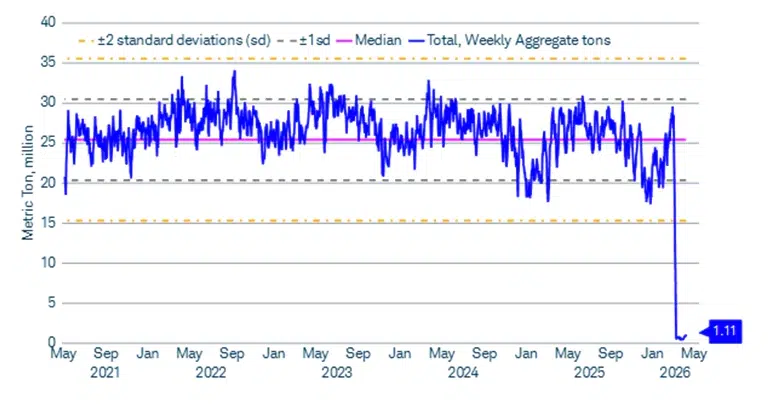
The most important thing to understand about the Iran war and oil prices right now is that the supply problem is not just about ship traffic. It is about production. CENTCOM confirmed that US forces had “completely halted economic trade going into and out of Iran by sea” in the first 36 hours of the naval blockade. IMF Managing Director Georgieva followed that with a stark assessment: “20% of oil and gas is still missing from the world economy.”
The Strait of Hormuz normally sees 15 to 35 million metric tons of trade per week. That figure has been collapsed to just 1.11 million metric tons as of April 8. That is not a slowdown. That is a near-total shutdown of the most critical energy chokepoint on the planet.
A Reuters poll of eight analysts found the oil market is now running a 750,000 barrel-per-day deficit for 2026, flipped from the 1.63 million bpd surplus that had been forecast before the war. The IEA estimated that roughly 11 million bpd had been effectively shut out of the market as of end of March. ANZ put the figure at around 9 million bpd removed.
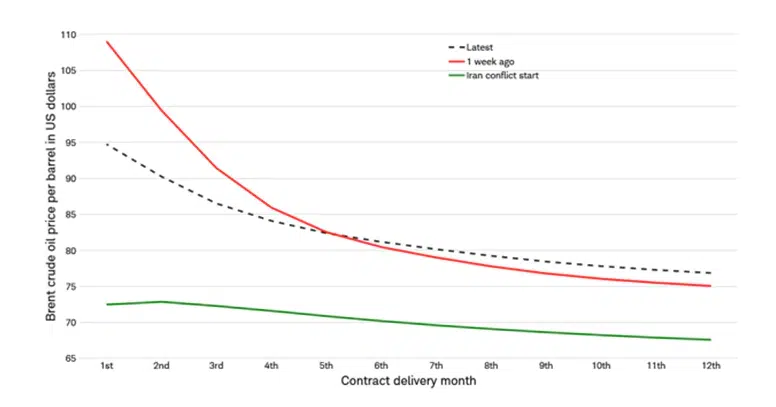
Even under a constructive peace scenario, ANZ analysts warned that “operational friction, damaged infrastructure and export bottlenecks mean recovery is unlikely to be smooth.” Restarting production takes four to eight weeks at minimum. Up to 1 billion barrels of lost supply would need to be replaced by drawing down global inventories, and 1 to 2 million bpd of capacity may be permanently impaired even after the conflict ends. The Brent futures curve is also still pricing this reality, as front-month contracts remain significantly higher than later delivery months, a structure that signals the physical shortage is very much active.
Also Read: When Are Taxes Due in 2026? The Iran War Is Pushing Social Security COLA Higher
| Scenario | USD and FX | Rates and Fed | Gold and Silver | Energy and Shipping | Credit and Liquidity | Macro Risk Level |
|---|---|---|---|---|---|---|
| Best case – full deal | DXY drifts lower toward mid 90s | Cut expectations stabilize, Fed less restrictive | Gold eases, silver softens but stays supported | Flows normalize, shipping pressure fades | Credit spreads tighten, liquidity improves | Low |
| Middle case – partial deal | DXY holds 97 to 100 | Cuts pushed to late 2026 | Gold holds above 5000, silver steady | Energy flows improve slowly, shipping remains tight | Credit spreads widen slightly | Medium |
| Worst case – talks collapse | DXY spikes above 100, EM FX under pressure | Fed stuck between inflation and recession | Gold breaks 5500, silver overshoots | Energy shock deepens, shipping disruptions escalate | Credit spreads widen sharply, liquidity stress builds | High |
This is the scenario Trump is signaling and markets are partly pricing in. Talks restart in Pakistan, a ceasefire-to-peace framework is agreed, the US blockade is lifted, and Hormuz reopens to full commercial traffic.
Brent initially crashes toward $70-75 as speculative long positions are unwound. However, the four-to-eight week production restart lag keeps the market in deficit through most of May. Charles Schwab rates this upside scenario as low probability for exactly this reason, noting that for Brent to fall below $75, a full peace agreement would need to be followed by a steady normalization of both production and shipping, which is a process that does not happen overnight even under ideal conditions.
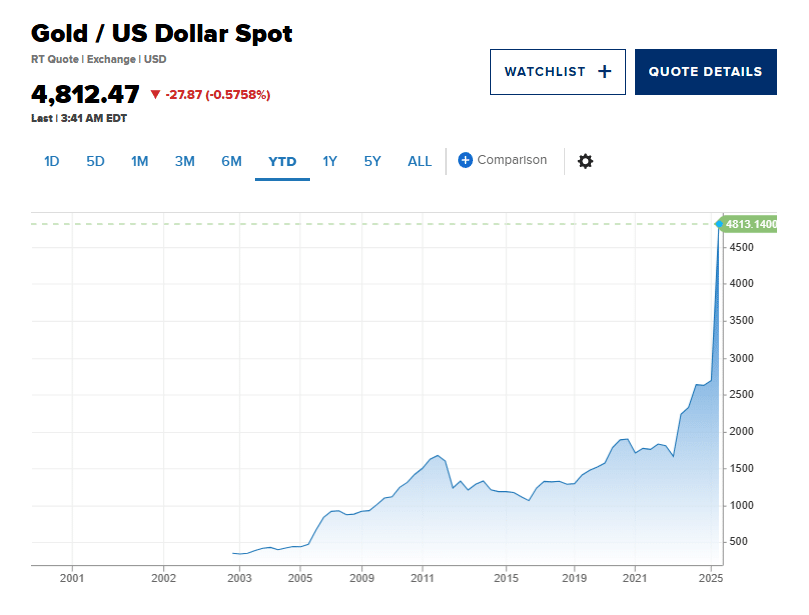
Gold pulls back from the $5,175 area but does not collapse. J.P. Morgan’s year-end 2026 target of $6,300/oz is maintained regardless of the near-term outcome, built on central bank buying, de-dollarization, and structural asset diversification rather than war risk alone. Their analysts wrote:
“Even with the recent near-term volatility, we remain firmly bullishly convinced in gold over the medium-term on the back of a clean, structural, continued diversification trend that has further to run amid a still well-entrenched regime of real asset outperformance vs. paper assets.”
Chinese gold ETF demand is also worth flagging here. Chinese funds added more than 500,000 oz in March alone, even as North American funds saw roughly 2 million oz in outflows during the same period. That divergence tells a clear story: the demand base for gold has already migrated, and the structural bid is not dependent on the war continuing.
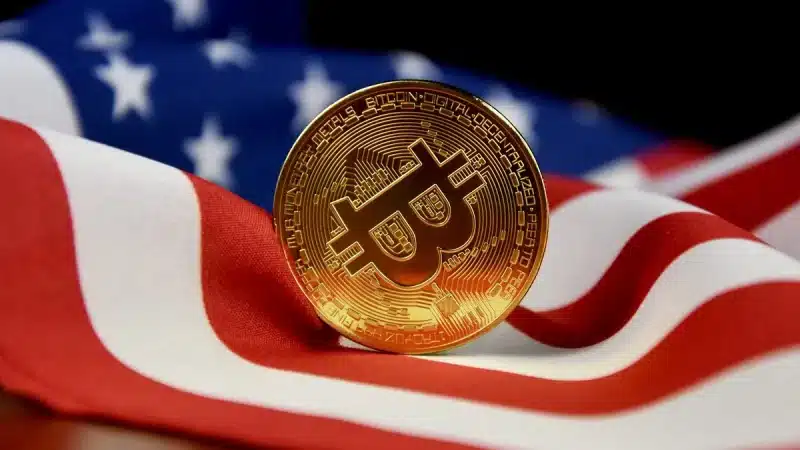
BTC clears the $75,000 resistance level that has capped every rally since the war began, and targets $85,000 to $90,000. On April 14, spot Bitcoin ETFs took in $1.1 billion in a single session, and $277 million in leveraged short positions were liquidated as BTC touched $76,120 on Bitstamp.
Ish Asad, research analyst at Bitwise, noted:
“while the S&P 500 is approaching record highs, Bitcoin remains down nearly 50% from its height and appears to have far more upside ahead.”
Bitwise CIO Matt Hougan went further, calling Iran’s reported move to collect Hormuz transit tolls in Bitcoin “a watershed moment”, as it is the first time a sovereign state has legitimized the asset for international commerce. Even if that arrangement does not survive a peace deal, the narrative has shifted in a way that is hard to walk back.
The S&P 500 stages a relief rally. Wells Fargo, which cut its year-end S&P 500 target to 7,300 from 7,800, is now forecasting a potential surge to that level by July driven by what the firm called a “three months of sugar high” with tax program tailwinds, AI monetization, and the US-hosted World Cup. Small-cap tech and AI chip stocks would lead. Deferred AI chip capex gets unlocked. The DXY drifts lower from the 98 area toward the mid-90s.
Tony Sycamore of IG captured the political logic:
“There is a growing expectation that the standoff will soon be resolved, allowing the U.S. administration to pivot towards declaring victory, before stimulating the economy ahead of the midterms.”
On rates, the CME FedWatch Tool is right now showing a 98% probability of the Fed holding at both the April 29 and June 17 meetings. A genuine peace deal shifts that math, and markets would start re-pricing some 2026 cuts back in, although the Fed’s own March minutes showed members did not rule out a rate hike if inflation stays above 2%.
Also Read: You Can Now Trade IBIT and 43 Other Stocks on Bybit Using BTC or ETH
Charles Schwab rates this “moderate” scenario, alongside the adverse case, as one of the two most likely outcomes right now. Military operations wind down, some shipping lanes reopen under Iranian conditions, sanctions stay in place, and Iran retains leverage over Hormuz. There is no clean exit.
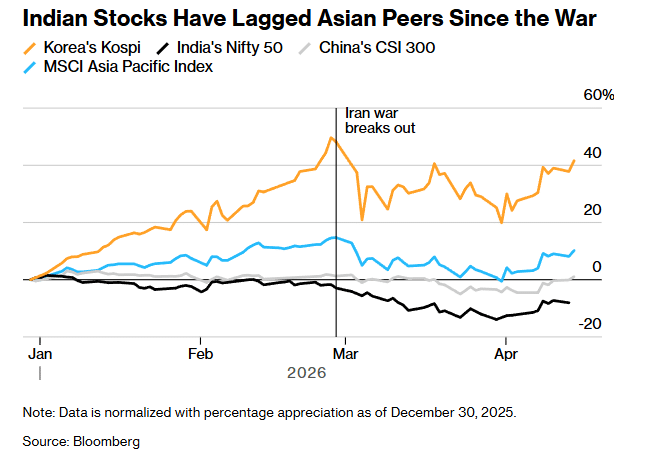
Brent stabilizes in the $85 to $90 range. The deficit persists through Q2. Inventories keep being drawn down. Asia, and more specifically India, which has lagged regional peers significantly since the war broke out, stays under sustained energy price pressure. The Brent futures curve flattens slightly but remains in backwardation, signaling the physical shortage is not resolved.
Gold holds above $5,000, with the war premium only partially priced out. Deutsche Bank holds a $6,000 year-end target. UBP (Union Bancaire Privee) reaffirmed its $6,000 call on April 13, stating that structural demand including central bank buying, fiscal-deficit concerns, and geopolitical tensions remains intact. Silver stays range-bound with an upside bias, supported by industrial demand from EVs, solar panels, and AI data center construction, all of which are long-term consumers of the metal at scale.
BTC chops in the $68,000 to $75,000 band. Every peace headline triggers a pop. Every setback sends it back down. Coin Bureau founder Nic Puckrin described the current recovery as “fragile,” and warned:
“Even if the war ends now, its repercussions will likely be the story of 2026, and certainly the dominant narrative for Q2. I don’t expect to see a rate cut until late Q3 or Q4, if at all.”
He also set out what a real breakout would actually need:
“For a push toward $90,000, we would need to see a combination of factors: a ceasefire that results in the end of geopolitical tensions, a sustained drop in oil prices toward $80, and ideally also softer-than-expected economic data that calms stagflation fears.”
In a partial-deal world, none of those three conditions are clearly met. Rate cuts remain delayed. The first meaningful probability of a cut on CME FedWatch only appears at the July 29 meeting, and even then sits at around 33.6%.
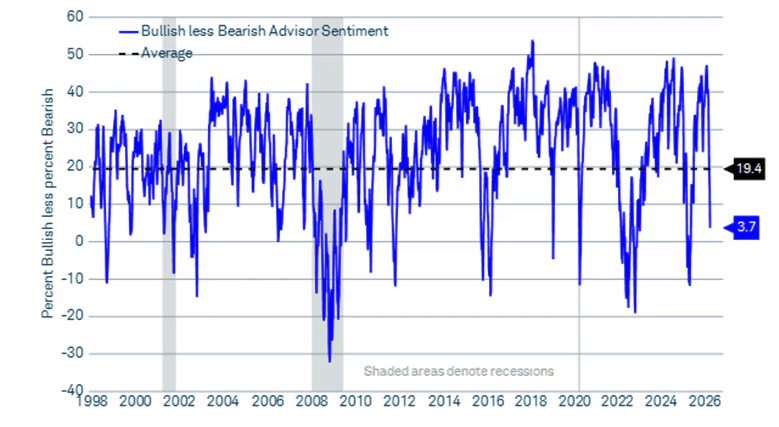
Stocks are choppy and headline-driven. Energy and defense outperform. Broad tech leadership is inconsistent. Investment advisor sentiment has already fallen sharply, as the the Investor Intelligence Bull-Bear spread is sitting at just 3.7, well below the long-term average of 19.4.
Janet Yellen, speaking at the HSBC Global Investment Summit in Hong Kong on April 15, said one rate cut was still possible in 2026 but emphasized that the Fed would be watching all available data very carefully before acting.
Also Read: China Is Stockpiling for War While US Housing Hits Its Worst Since 2009
Citadel’s Ken Griffin was unambiguous at the IMF and World Bank Spring Meetings on April 14. “The world’s going to end up in a recession, there’s no way to avoid that,” he said, specifying that a six-to-twelve month closure of the Strait of Hormuz would make a global downturn unavoidable.
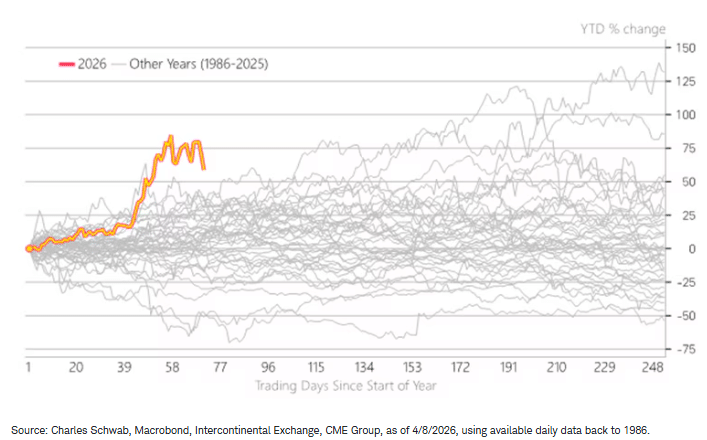
Brent surges back above $100, with spikes toward $120 or higher becoming plausible. The IMF’s worst-case scenario puts the global oil price averaging $110 per barrel in 2026 and $125 in 2027. Schwab’s severe scenario puts Brent exceeding $125 with volatility persisting into Q4. Year-to-date in 2026, oil prices have already risen at the fastest rate since records go back to 1986, and a sustained blockade through summer would extend that record further into uncharted territory.
Demand destruction would follow (not just higher gasoline prices, but actual shortages and rationing) in import-dependent economies across South and Southeast Asia. Macquarie’s Vikas Dwivedi estimated that 136 million barrels of crude and products are currently stuck in the Gulf due to the conflict, and clearing that backlog takes weeks even under favorable conditions.
Gold breaks above $5,500 and potentially accelerates toward J.P. Morgan’s $6,300 year-end target ahead of schedule.
Gregory Shearer, Head of Base and Precious Metals Strategy at J.P. Morgan, has said that:
“In the near term, the potential for a swift lengthening to recent highs in investor gold futures positioning points to a possible +5-10% risk premium jump in gold prices from here.”
Central bank buying accelerates, Chinese ETF demand keeps building, and Western safe-haven flows also come back in force.
BTC tests $68,000 support and risks a move toward $55,000 to $60,000. This is the scenario where spot ETF ownership becomes a liability rather than a strength. Institutional managers liquidating equity positions in a genuine bear market will also liquidate their Bitcoin ETF holdings to cover margin calls and reduce overall portfolio risk. Forced sellers dominate in the short term, regardless of long-term narrative. Standard Chartered, which cut its year-end Bitcoin target to $100,000 from $150,000, cited exactly this macro risk backdrop in its revision.
Also Read: Trump Blockades Hormuz, China Sails Through Anyway and Iran Posts DC Gas Prices
The S&P 500 makes new lows. The DXY spikes back above 100 as global dollar funding stress returns. Credit spreads widen significantly. Schwab’s severe scenario describes a “global equity bear market; credit stress propagates; classic flight to safety.” The Fed gets trapped between oil-driven inflation and collapsing growth. Rate cuts would come eventually, but only after something in credit or labor markets breaks first.
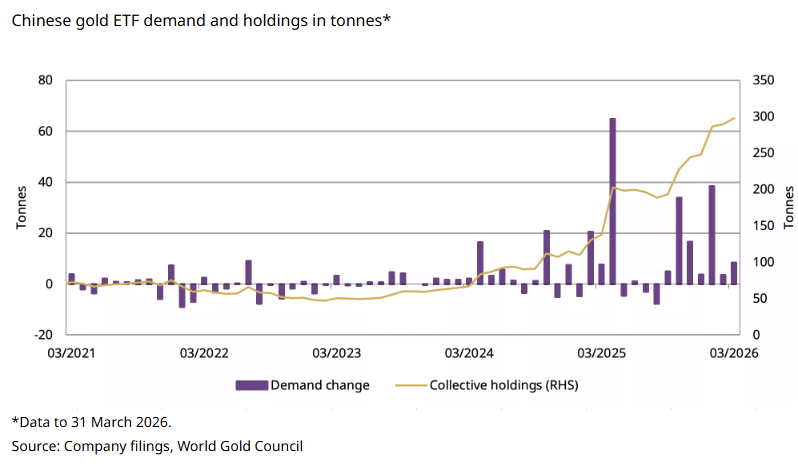
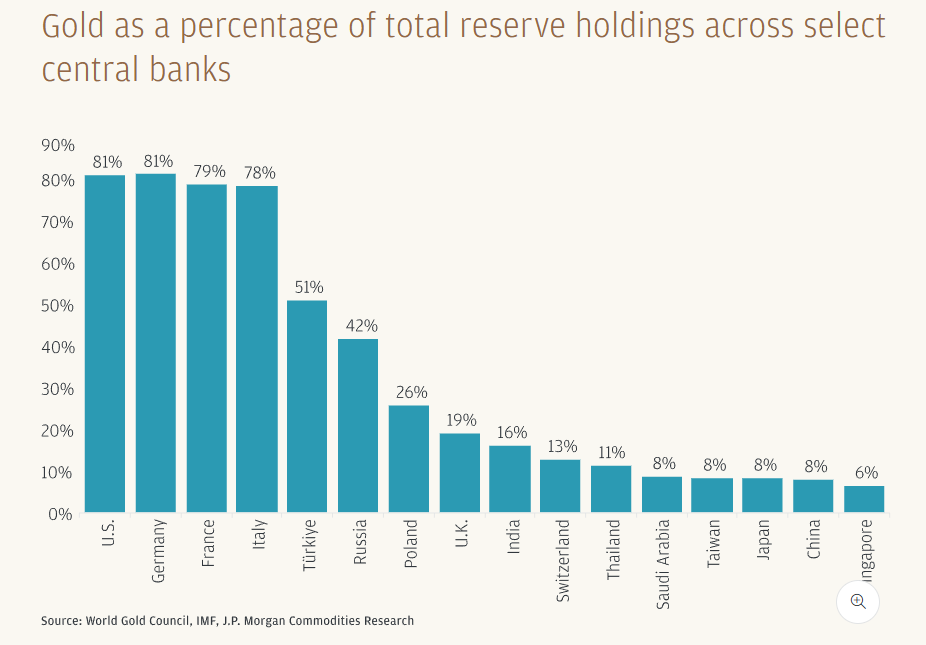
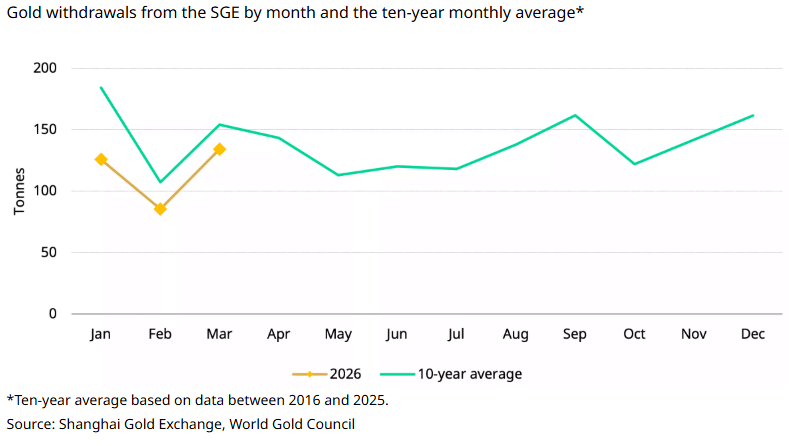
Whatever comes out of Pakistan, one thing has shifted in a lasting way: gold’s demand base is no longer centered in Western markets. Chinese gold ETF collective holdings have reached close to 300 tonnes as of March 2026, up dramatically from prior years. Withdrawals from the Shanghai Gold Exchange are also being tracked ahead of the 10-year average so far in 2026. And gold’s share of global investor AUM has reached 2.8%, which is still historically low, but rising steadily.
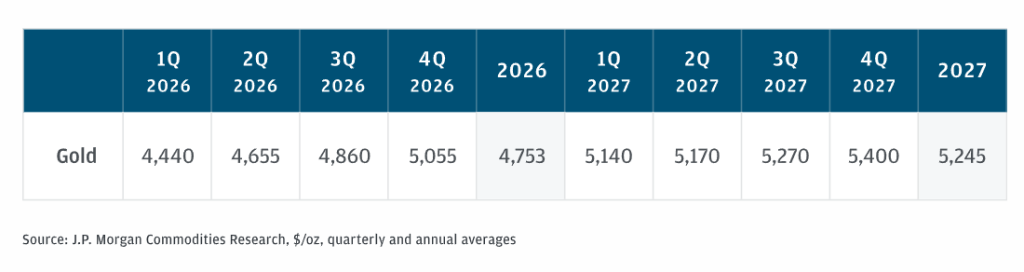
J.P. Morgan’s quarterly forecast table puts gold at $4,440 for Q1 2026, rising through the year to $5,055 by Q4 2026, and then continuing to $5,400 by Q4 2027. That progression does not require an escalating war to be correct. It requires the current macro regime of fiscal deficits, de-dollarization, and central bank demand to continue, and all three of those drivers were firmly in place long before February 28.
Also Read: Morgan Stanley’s Bitcoin ETF Draws $34M on Debut as ETFs Pull $358M
The Iran war is not over yet, whatever the presidential framing suggests. The tell this time will not be in statements or social media posts. It will be in tanker traffic data through the Strait of Hormuz.
MarineTraffic and Lloyd’s vessel tracking will show whether commercial shipping is actually moving before any official deal is announced. Markets should trust ships, not statements.
A few other signals are worth watching closely right now:
The US Treasury’s 30-day sanctions waiver on Iranian oil expires on April 19, and Treasury Secretary Scott Bessent has already said “China will not get Iranian oil”, which is a position that, if held, extends the supply shock regardless of diplomatic outcomes.
Also Read: Iran War Accelerates De-Dollarization as Russia Fills the Energy Vacuum
The Iran war has already reshuffled the global macro order in ways that do not simply reset with a peace announcement:
Whatever comes out of the next round of talks, these markets are not going back to February 27.

Written by Vladimir Popescu
Vladimir Popescu leads editorial coverage at BlockNow, with over 8 years in financial and tech journalism. He previously held editorial leadership roles at Watcher Guru and Windows Report, and has been cited by Forbes for his crypto market coverage.