
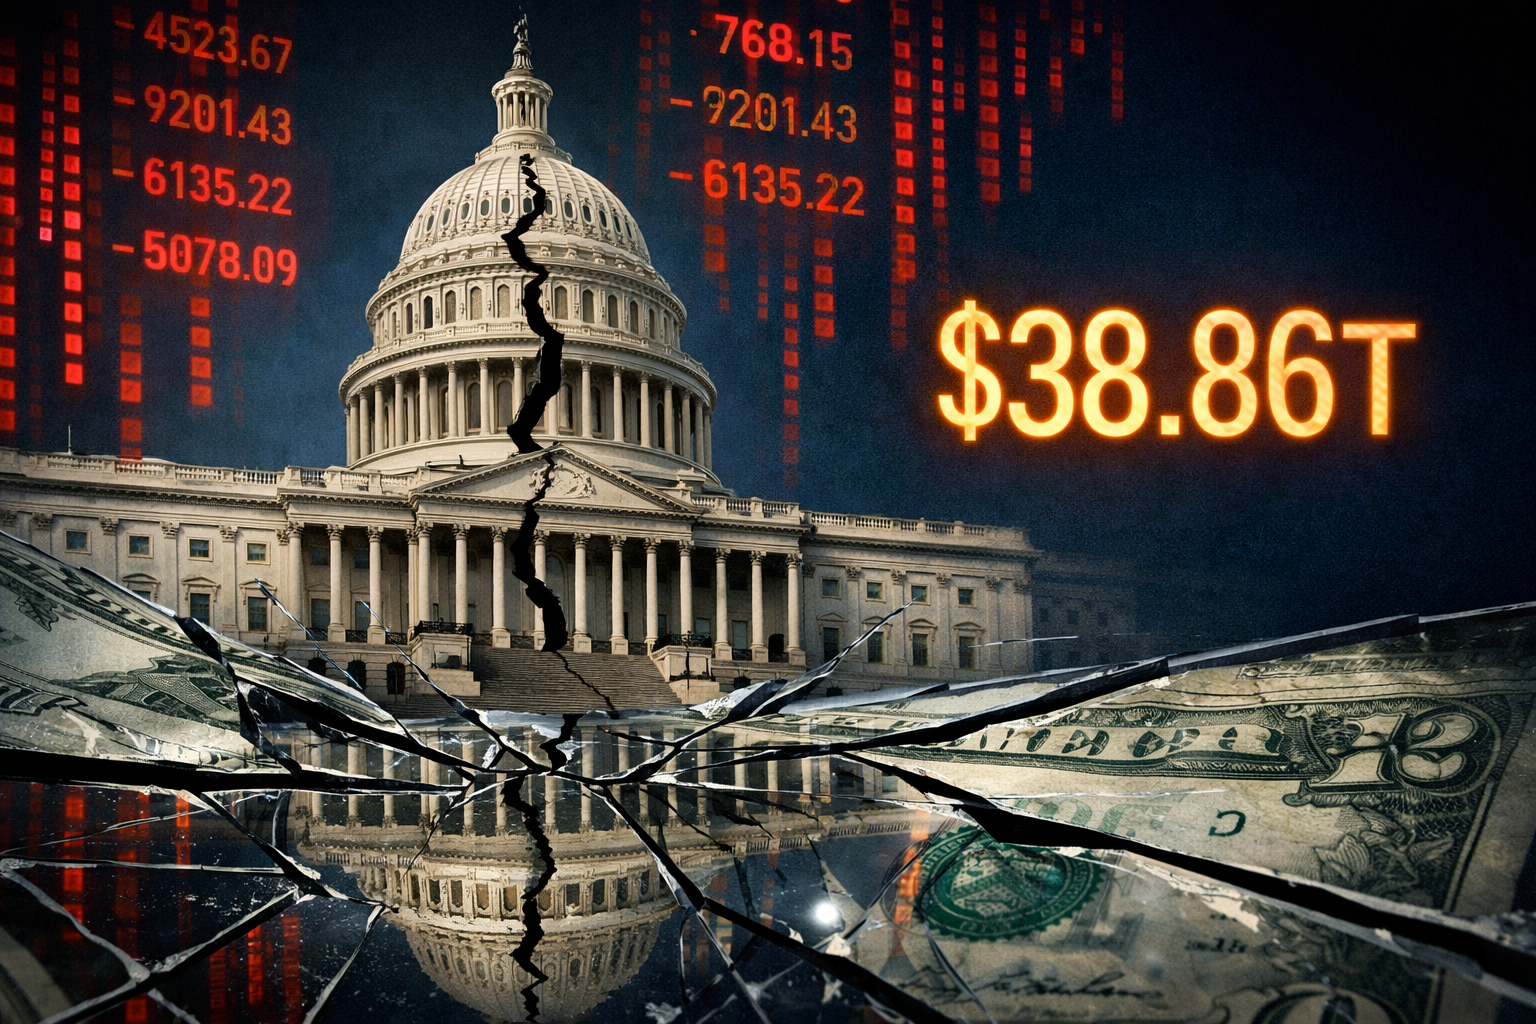


Markets
July 25, 2026
China Gold Market Shift Forces Banks to Suspend Retail Paper Trading
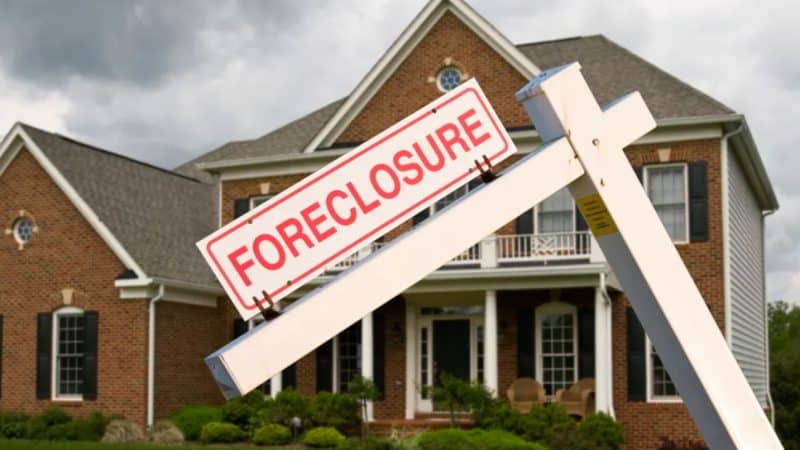
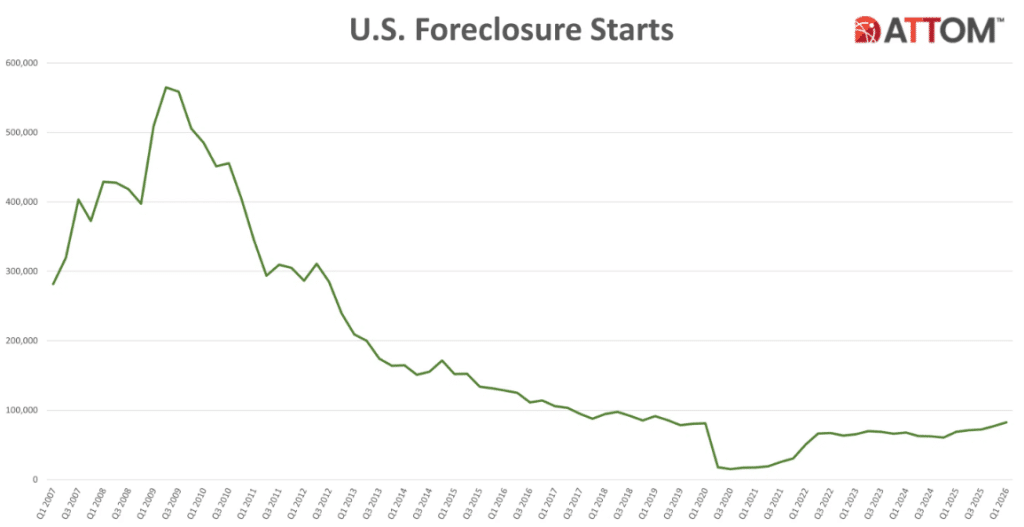
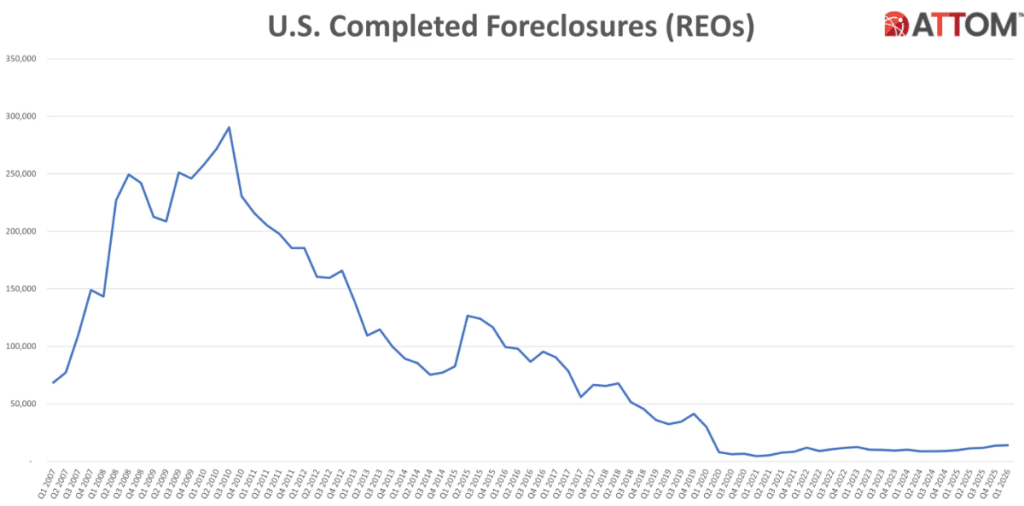
US foreclosures reached 118,727 filings in Q1 2026, the highest level since 2020 and a 26% jump from the same period last year. That works out to roughly one in every 1,211 housing units across the country. Bank repossessions, also known as REOs, climbed 45% year over year to 14,020, and foreclosure starts rose 20% annually to 82,631. The housing crisis in 2026 is no longer a regional problem, and the US housing market is starting to reflect the full weight of years of compounding costs that middle-class homeowners simply cannot absorb anymore.
Also Read: Iran Strikes UAE’s Fujairah Port, Only Hormuz Bypass Burning, Oil Hits $114
Indiana ranked first in the nation with one in every 739 homes receiving a foreclosure filing in Q1 2026. South Carolina came in second at one in 743, and Florida placed third at one in 750. Georgia, North Carolina, and Texas also posted sharp year-over-year increases, with Georgia up 78% and North Carolina up 56% compared to Q1 2025.
Illinois, New Jersey, and Ohio rounded out some of the highest raw filing numbers, with Ohio recording 5,499 filings and New York logging 6,582. California, as the most populous state, had 12,318 filings in total, though its rate per housing unit remained lower than many smaller states.
Florida’s numbers also carry extra weight given what’s been happening with insurance costs in Sun Belt markets. Property insurance premiums have doubled in many parts of the state over the past two years, and that added expense is now also being cited as a direct factor pushing homeowners who were already stretched into foreclosure. People in these markets are losing homes they technically own, not because of bad loans, but because the monthly cost of keeping them has become unmanageable.
Also Read: Palantir Q1 Earnings: Revenue Soars 85% to $1.63B, Karp Puts Defense First
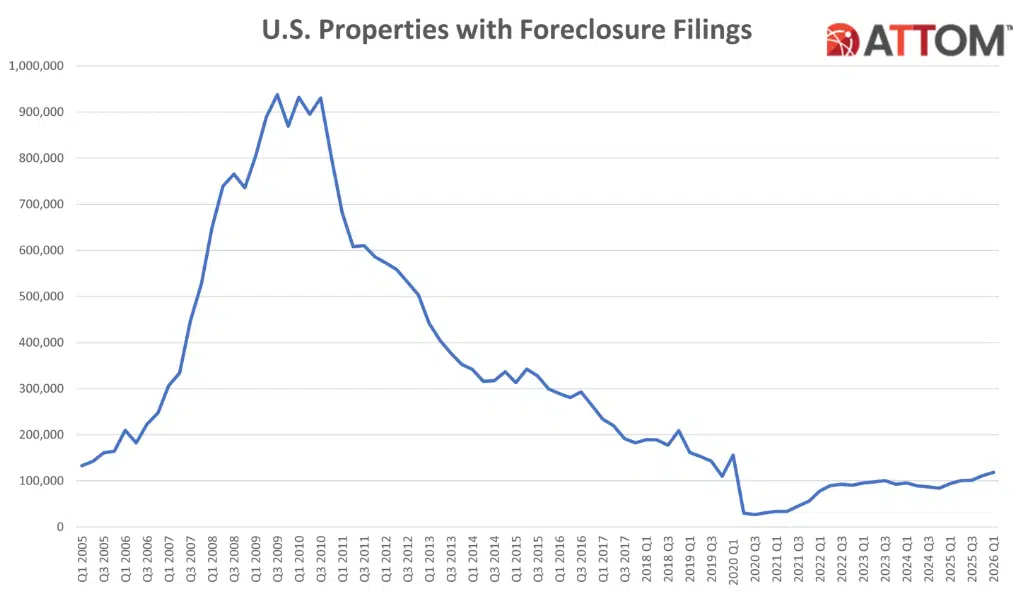
The numbers being reported for Q1 2026 are the result of 12 consecutive months of annual increases in foreclosure activity, according to ATTOM data. Rob Barber, CEO of ATTOM, noted that the trend reflects “a convergence of economic pressures that are increasingly difficult for homeowners to manage.”
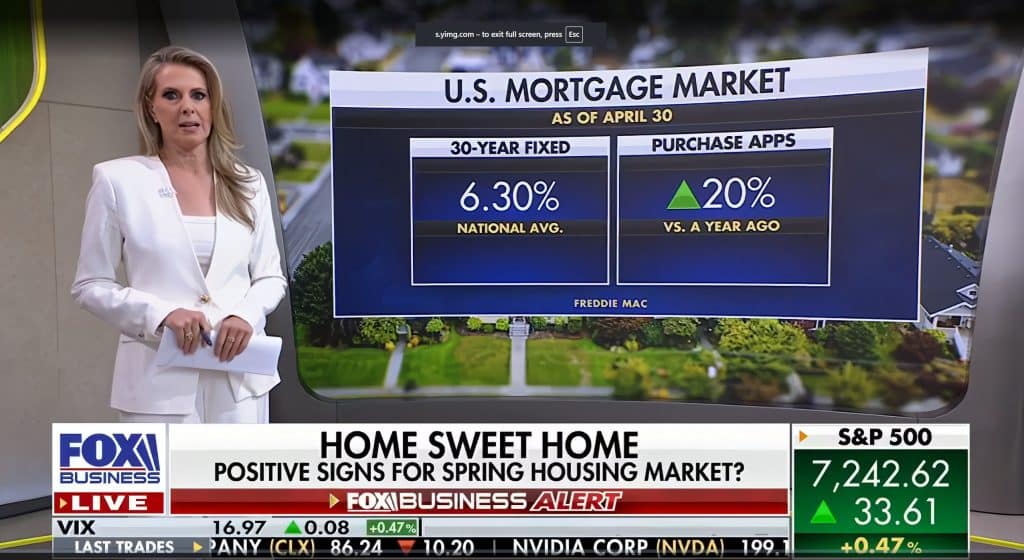
Mortgage payments now account for roughly 30% of median household income, up from around 21% before the pandemic. Rates on 30-year fixed mortgages have stayed above 7% for extended stretches, and property taxes alongside insurance have added hundreds of dollars per month to ownership costs in many regions.
FHA loan delinquency rates hit 11.52% in Q1 2026, the highest level since 2021. The loan cohorts originated in 2022 and 2023, when prices were near their pandemic peak and rates were rising fast, are now showing the worst performance. Homeowners who also bought at the top cannot sell without taking a loss, cannot refinance into a better rate, and are running out of room to keep up with payments.
Also Read: Tether Buys 132 Tonnes Gold Worth $19.8B, Outbuying Fed ECB BoE
The average time to complete a foreclosure in Q1 2026 was 577 days. That’s actually down from the peak seen in recent years, which in some cases stretched past 1,200 days, and it suggests the legal backlog built up during the pandemic moratorium period is being processed more efficiently now.
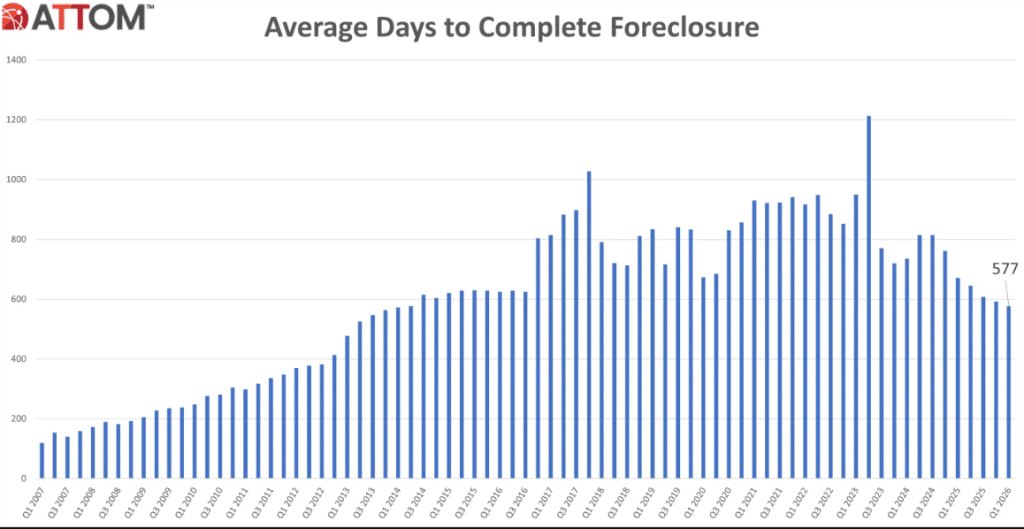
What that also means, though, is that the properties currently entering the foreclosure process will start hitting completion numbers later this year and into 2027. The pipeline is filling faster than it’s being cleared.
Rob Barber also said that “while the overall numbers remain well below the crisis levels seen during the Great Recession, the consistent upward trend is a clear signal that financial stress is mounting across the housing market.”
Also Read: Clarity Act Markup Set May 11, Ending Crypto Wild West Era for Wall Street
Below is the full breakdown of US foreclosure filings by state for Q1 2026, including rate rankings, total filings, and year-over-year changes. It was split into two sections for more accessible reading.
| Rate Rank | State | Total Filings | 1 in Every X HU | % Change Q4 2025 | % Change Q1 2025 |
|---|---|---|---|---|---|
| U.S. Total | — | 118,727 | 1,211 | +6.30% | +26.37% |
| 1 | Indiana | 4,028 | 739 | +44.94% | +33.16% |
| 2 | South Carolina | 3,288 | 743 | -5.68% | +39.74% |
| 3 | Florida | 13,683 | 750 | -0.99% | +43.67% |
| 4 | Delaware | 613 | 757 | +4.07% | +1.83% |
| 5 | Illinois | 6,551 | 833 | +5.32% | +3.08% |
| 6 | Nevada | 1,566 | 847 | +5.53% | +4.68% |
| 7 | New Jersey | 4,166 | 910 | -1.33% | +14.04% |
| 8 | Maryland | 2,732 | 937 | +0.52% | +43.87% |
| 9 | Ohio | 5,499 | 962 | +11.41% | +32.99% |
| 10 | Georgia | 4,549 | 998 | +24.09% | +77.83% |
| 11 | Utah | 1,219 | 1,004 | +4.10% | +19.39% |
| 12 | Texas | 11,568 | 1,048 | +6.05% | +23.67% |
| 13 | Arizona | 2,807 | 1,137 | +23.77% | +31.05% |
| 14 | Alabama | 1,996 | 1,171 | +23.59% | +38.71% |
| 15 | North Carolina | 4,141 | 1,182 | +29.81% | +55.79% |
| 16 | Iowa | 1,210 | 1,188 | +0.50% | +14.47% |
| 17 | California | 12,318 | 1,189 | +12.34% | +15.11% |
| 18 | Colorado | 2,092 | 1,238 | +14.07% | +74.04% |
| 19 | New York | 6,582 | 1,304 | +10.14% | +32.92% |
| 20 | Pennsylvania | 4,244 | 1,368 | -2.79% | +19.92% |
| 21 | Louisiana | 1,515 | 1,392 | -6.25% | +15.74% |
| 22 | Arkansas | 947 | 1,473 | +3.95% | +65.27% |
| 23 | Wyoming | 186 | 1,490 | +8.14% | +46.46% |
| 24 | Michigan | 3,050 | 1,515 | +10.87% | +4.92% |
| 25 | Oklahoma | 1,163 | 1,526 | -17.28% | +2.29% |
The bottom half of the table tells a different story in terms of raw rates, but the year-over-year increases are just as telling. Colorado jumped 74% annually, Idaho 76%, Arkansas 65%, and Montana 68%, all states that saw rapid price appreciation during the pandemic years and are now dealing with the hangover. These are not traditionally high-foreclosure markets, which makes the acceleration there worth watching closely heading into Q2.
| Rate Rank | State | Total Filings | 1 in Every X HU | % Change Q4 2025 | % Change Q1 2025 |
|---|---|---|---|---|---|
| 26 | New Mexico | 615 | 1,556 | +17.59% | +30.30% |
| 27 | Idaho | 506 | 1,571 | +1.40% | +75.69% |
| 28 | Alaska | 198 | 1,615 | +10.00% | +66.39% |
| 29 | Connecticut | 938 | 1,644 | -3.10% | -27.57% |
| 30 | Missouri | 1,541 | 1,833 | +11.51% | +48.89% |
| 31 | Minnesota | 1,331 | 1,912 | -0.45% | +25.45% |
| 32 | Tennessee | 1,604 | 1,960 | -3.08% | +37.92% |
| 33 | Maine | 377 | 1,994 | -15.47% | +3.86% |
| 34 | Kentucky | 986 | 2,052 | +1.44% | +5.34% |
| 35 | Massachusetts | 1,447 | 2,094 | -8.94% | +5.62% |
| 36 | Virginia | 1,751 | 2,104 | -16.66% | +16.19% |
| 37 | Washington | 1,434 | 2,306 | -10.77% | +25.02% |
| 38 | Oregon | 752 | 2,471 | -9.62% | +50.10% |
| 39 | Hawaii | 223 | 2,547 | 0.00% | +18.62% |
| 40 | Mississippi | 491 | 2,731 | +20.94% | +64.77% |
| 41 | New Hampshire | 234 | 2,771 | -3.70% | +21.24% |
| 42 | Nebraska | 310 | 2,785 | +10.71% | +14.81% |
| 43 | Wisconsin | 927 | 2,997 | +13.33% | +9.70% |
| 44 | Rhode Island | 148 | 3,283 | -24.87% | -22.11% |
| 45 | North Dakota | 113 | 3,339 | +14.14% | +24.18% |
| 46 | Kansas | 381 | 3,395 | +7.93% | +38.55% |
| 47 | Montana | 104 | 5,081 | +2.97% | +67.74% |
| 48 | West Virginia | 168 | 5,127 | -7.18% | -23.29% |
| 49 | Vermont | 50 | 6,781 | +13.64% | +11.11% |
| 50 | South Dakota | 57 | 7,107 | +83.87% | +185.00% |
Also Read: Buffett Warns Dollar Could Collapse as Berkshire Hits $397B Cash, 14th Quarter Selling
The S&P 500 hit record highs in Q1 2026, and corporate profits also continued to climb. That disconnect is probably the sharpest way to describe what’s happening right now in the US housing market. Stock indices reflect large-cap earnings and investor sentiment. They do not reflect the family in Indiana who bought a home in 2022 at 6.5% and is now dealing with a property tax bill that went up 30% and an insurance renewal that came in at double last year’s rate.
The housing crisis of 2026 is not a subprime crisis, not exactly. Most of the loans being defaulted on were originated under normal underwriting standards. What changed was everything around the loan:
FHA borrowers are the most exposed right now, and the delinquency numbers from Q1 also reflect that clearly.
Also Read: Iran Nuclear Deal Offers 3.5% Uranium Cap as Trump Deploys Destroyers Anyway
The foreclosure news is also coming out of Q1 2026, and doesn’t pose a crisis in the 2008 sense, not yet. But the direction is consistent and the pace is accelerating. Twelve straight months of year-over-year increases, a 45% spike in completed bank repossessions, and FHA delinquency at its worst since 2021 are not coincidences. They are the result of a housing market that became unaffordable not just to buyers, but also to people who already own.

Written by Vladimir Popescu
Vladimir Popescu leads editorial coverage at BlockNow, with over 8 years in financial and tech journalism. He previously held editorial leadership roles at Watcher Guru and Windows Report, and has been cited by Forbes for his crypto market coverage.